
01
Separate network wait from execution cost.
Review resource load timing and browser execution time independently so a slow response and expensive script work are not collapsed into one number.
THIRD-PARTY PERFORMANCE AND RELIABILITY
Connect resource loading, execution time, errors, observed successful-response rates, and available session context to the provider behind them—so your teams can investigate with clearer browser-side evidence.

DEFINE THE THIRD-PARTY RELIABILITY LAYER
Third-party performance and reliability monitoring observes external browser resources, their response and execution timing, errors, successful-response rates in captured traffic, and appearance in captured website sessions. It helps teams investigate a change in its provider and dependency context while working alongside real user monitoring, synthetic testing, application performance monitoring, and vendor service management.
Review resource load timing and browser execution time independently so a slow response and expensive script work are not collapsed into one number.
Review the resource alongside available page, session, device, error, and dependency context before drawing a conclusion.
Give the appropriate internal or vendor owner browser-side evidence they can validate in the team's existing incident and change-management workflow.
A THIRD-PARTY JOURNEY TRACE
A provider can respond slowly, execute expensive code, throw errors, fail conditionally, or delay a dependent function. Review the individual resource with available session and dependency context, compare current observations with metric history, and separate observed correlation from a confirmed root cause.
Distinguish request and loading delay from script execution cost for the specific resource observed in the browser.
Investigate the resource alongside captured page, session, device, error, telemetry, and dependency context where available.
Evaluate continued loading, a narrower supported policy, or blocking the resource where enforcement is deployed and appropriate.
Journey reliability trace
journey / resource / timing / effect
Observed journey
checkout / mobile / EU
FROM RESOURCE REGRESSION TO PROVIDER CONTEXT
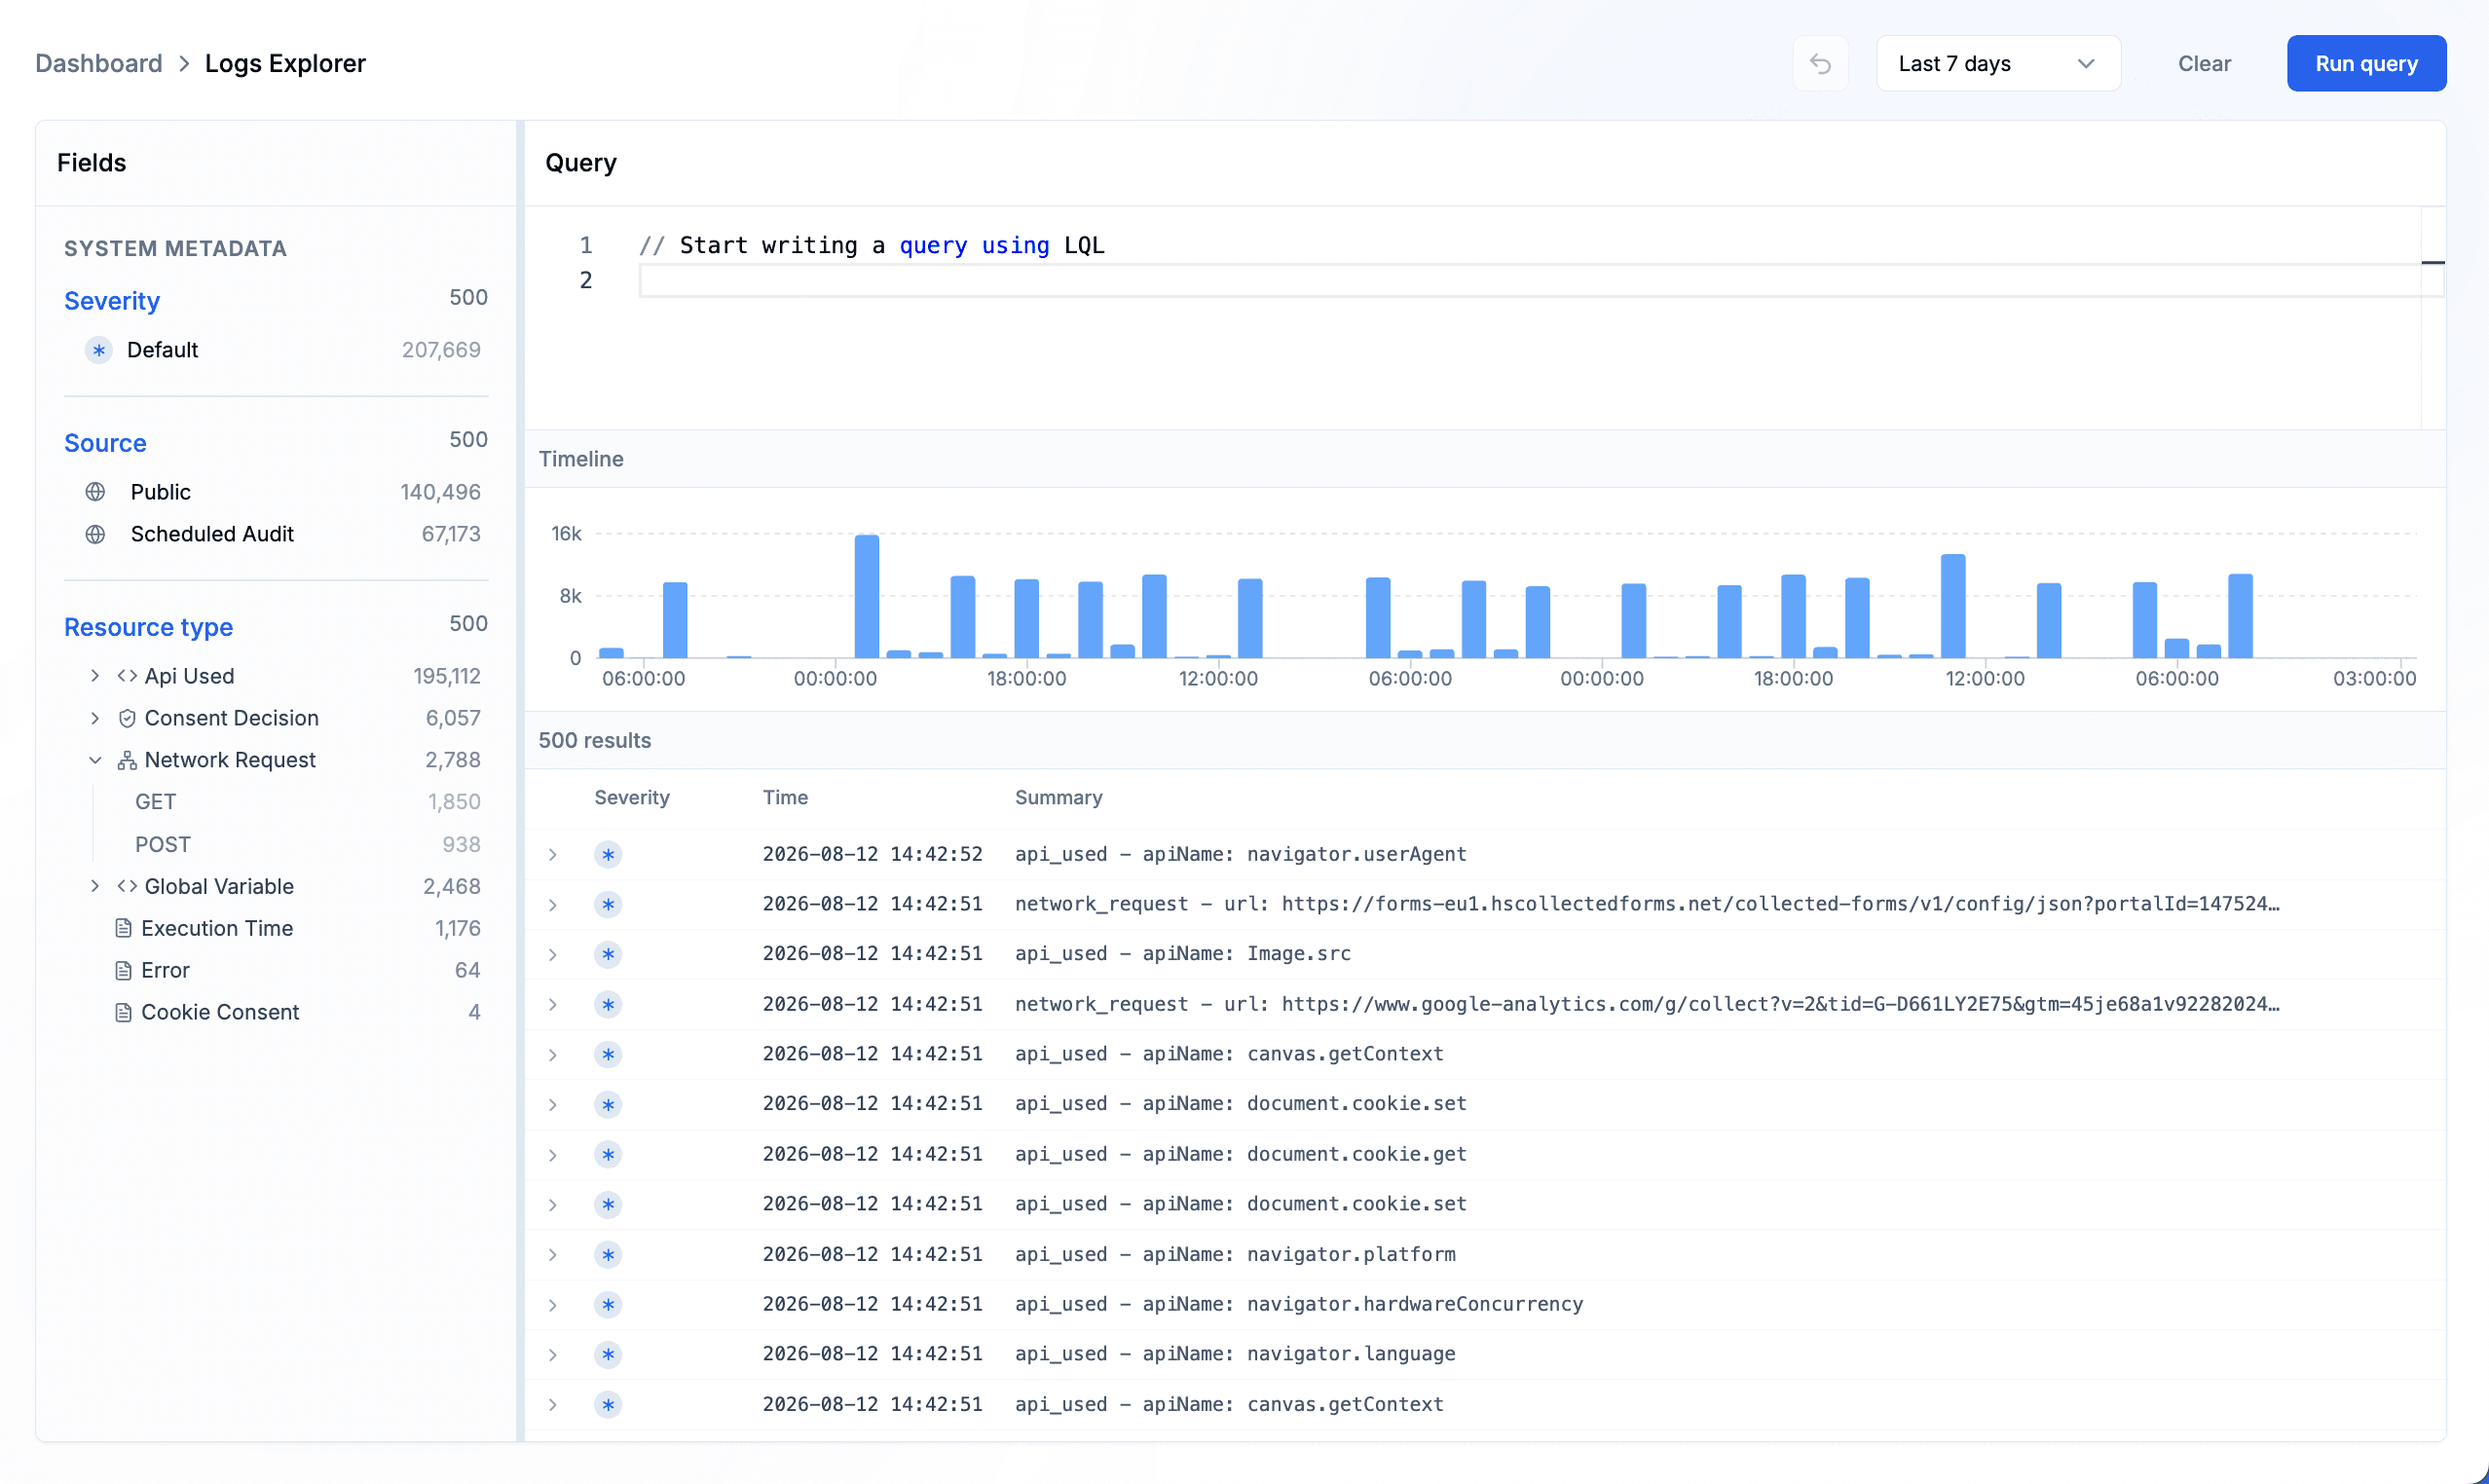
A resource URL is only one part of the investigation. Move from the browser event list into an individual telemetry record, then expand nested metadata to inspect the observed API, initiating resource, network activity, and surrounding runtime context.
Review observed API use, network requests, execution timing, errors, and other browser events in one investigation view.
Open an event without leaving the result set, then inspect the captured fields associated with that observation.
Expand nested metadata to connect an observed browser capability or request with the resource that initiated it.
FROM REGRESSION TO OWNED RELIABILITY WORK
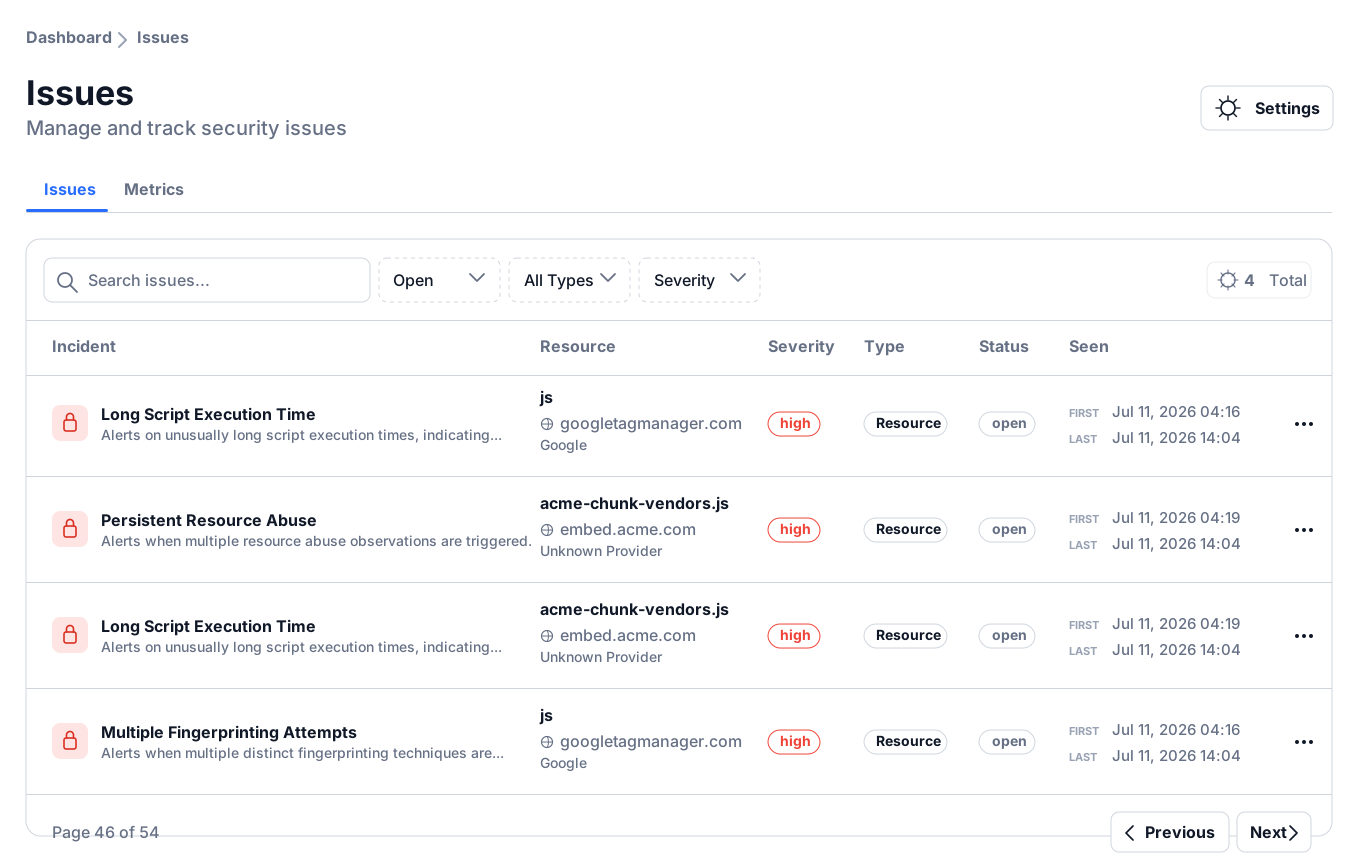
When an issue or anomaly is surfaced, open the record to inspect its resource, provider, timing, and available affected-session context. That browser evidence can then be shared with the appropriate owner through the incident, service-management, or change-management workflow your teams already follow.
Open the surfaced record to review the observed behavior, affected resource, provider, severity, timing, and supporting technical detail.
Inspect available sessions associated with the observation to help the responsible team reproduce and evaluate the behavior.
Share the resource, provider, anomaly, and session context with the internal team or external service relationship able to investigate it.
A CONTINUOUS RELIABILITY LOOP
This recommended operating loop joins browser observation, available session context, ownership, controlled response, and verification so third-party behavior can be investigated beyond aggregate site metrics.
Use available resource metric history together with page, session, device, dependency, and business-purpose context from your broader performance practice.
Review timing shifts, failures, script errors, observed successful-response rates, and provider or resource changes using current and historical observations.
Use available sessions, resource load relationships, application releases, provider status, and complementary telemetry to investigate the observation.
Coordinate owners, test a supported configuration or policy response, maintain rollback, and verify subsequent browser behavior.
ONE PROVIDER, MULTIPLE RELIABILITY OWNERS
Shared resource, provider, and available session context can reduce handoff friction without replacing application, commercial, vendor, or production records.
Investigate network and execution timing, dependency behavior, page impact, releases, errors, and safe loading strategies.
Correlate browser evidence with service telemetry, synthetic tests, logs, traces, availability objectives, incidents, and operational response.
Confirm business purpose, provider status, contractual context, customer impact, acceptable degradation, escalation, and future review.
Go deeper into the controls, evidence, and related use cases behind this workflow.
Investigate observed scope and evaluate a bounded browser policy response.
Follow direct and indirect dependencies when a provider or resource changes.
Inspect captured resource behavior and session context behind a signal.
See how browser discovery, investigation, policy control, and supporting evidence work together.
THIRD-PARTY RELIABILITY FAQ
Understand which signals can be attributed, how to interpret observed impact, and where dedicated performance and availability tooling remains necessary.
It is the observation of how external browser resources load and execute, including timing, errors, successful-response rates in captured traffic, dependencies, and their appearance in captured website journeys.
Browser-side support:Resource and provider context helps teams investigate changes that aggregate page metrics can obscure.
Useful signals can include resource load duration, execution time, size, request timing, errors, presence, dependencies, page context, captured-session reach, and functionality or performance anomalies.
Browser-side support:Interpret them alongside Core Web Vitals, RUM, synthetic tests, traces, application telemetry, and business outcomes.
No. Timing overlap establishes observation and correlation, not causation. Main-thread work, dependencies, application code, network conditions, device capability, caching, and measurement coverage can all affect the result.
Browser-side support:Reproduce the journey, compare representative samples, and validate with complementary tools before assigning root cause.
No. It observes supported resources in captured browser traffic and may miss geographies, users, conditions, routes, or failures that prevent telemetry from arriving.
Browser-side support:Combine browser observation with synthetic checks, provider status, server telemetry, SLAs, and other availability evidence.
Review available page, session, device, error, timing, and dependency context alongside abandonment, conversion, support, and other product data.
Browser-side support:Browser evidence contributes technical context; product and analytics data are needed for a business-impact conclusion.
Supported policy responses depend on the resource, application design, deployment, enforcement mode, and available provider- or resource-level controls.
Browser-side support:Test functionality and data effects, coordinate the owner, choose the narrowest supported response, and retain rollback before changing production behavior.
Use available metric history alongside baselines maintained in your RUM, synthetic, APM, or performance workflow, segmented where those tools and data support it.
Browser-side support:Use representative ranges and review thresholds rather than presenting one number as the provider's guaranteed performance.
No. Those tools provide broader user-experience, controlled test, application, and standardized performance views. Browser resource monitoring adds provider and script attribution.
Browser-side support:Use the views together to connect overall experience with the third-party code and relationships active in the browser.
Review browser-side timing, execution, errors, observed successful-response rates, provider, dependency, and available session context alongside the performance stack your teams already use.