
resources
Resource activity
Review resource counts, processed resources, and observed sessions to understand the scale of monitored activity. A change in activity can help explain a change in totals.
BROWSER SECURITY ANALYTICS
SiteWall by CellWall brings resource, performance, and issue metrics into a client-side security workflow. Security and engineering teams can explore defined measurements, inspect available history, and investigate the browser activity behind a change. Use third-party script performance monitoring alongside security findings to decide where a closer review is needed.

START WITH THE DEFINITION
Open a metric to see its description and aggregation type before interpreting the chart. Counts, averages, and distributions answer different questions. A shared definition gives security and engineering a clearer starting point than an unexplained score.
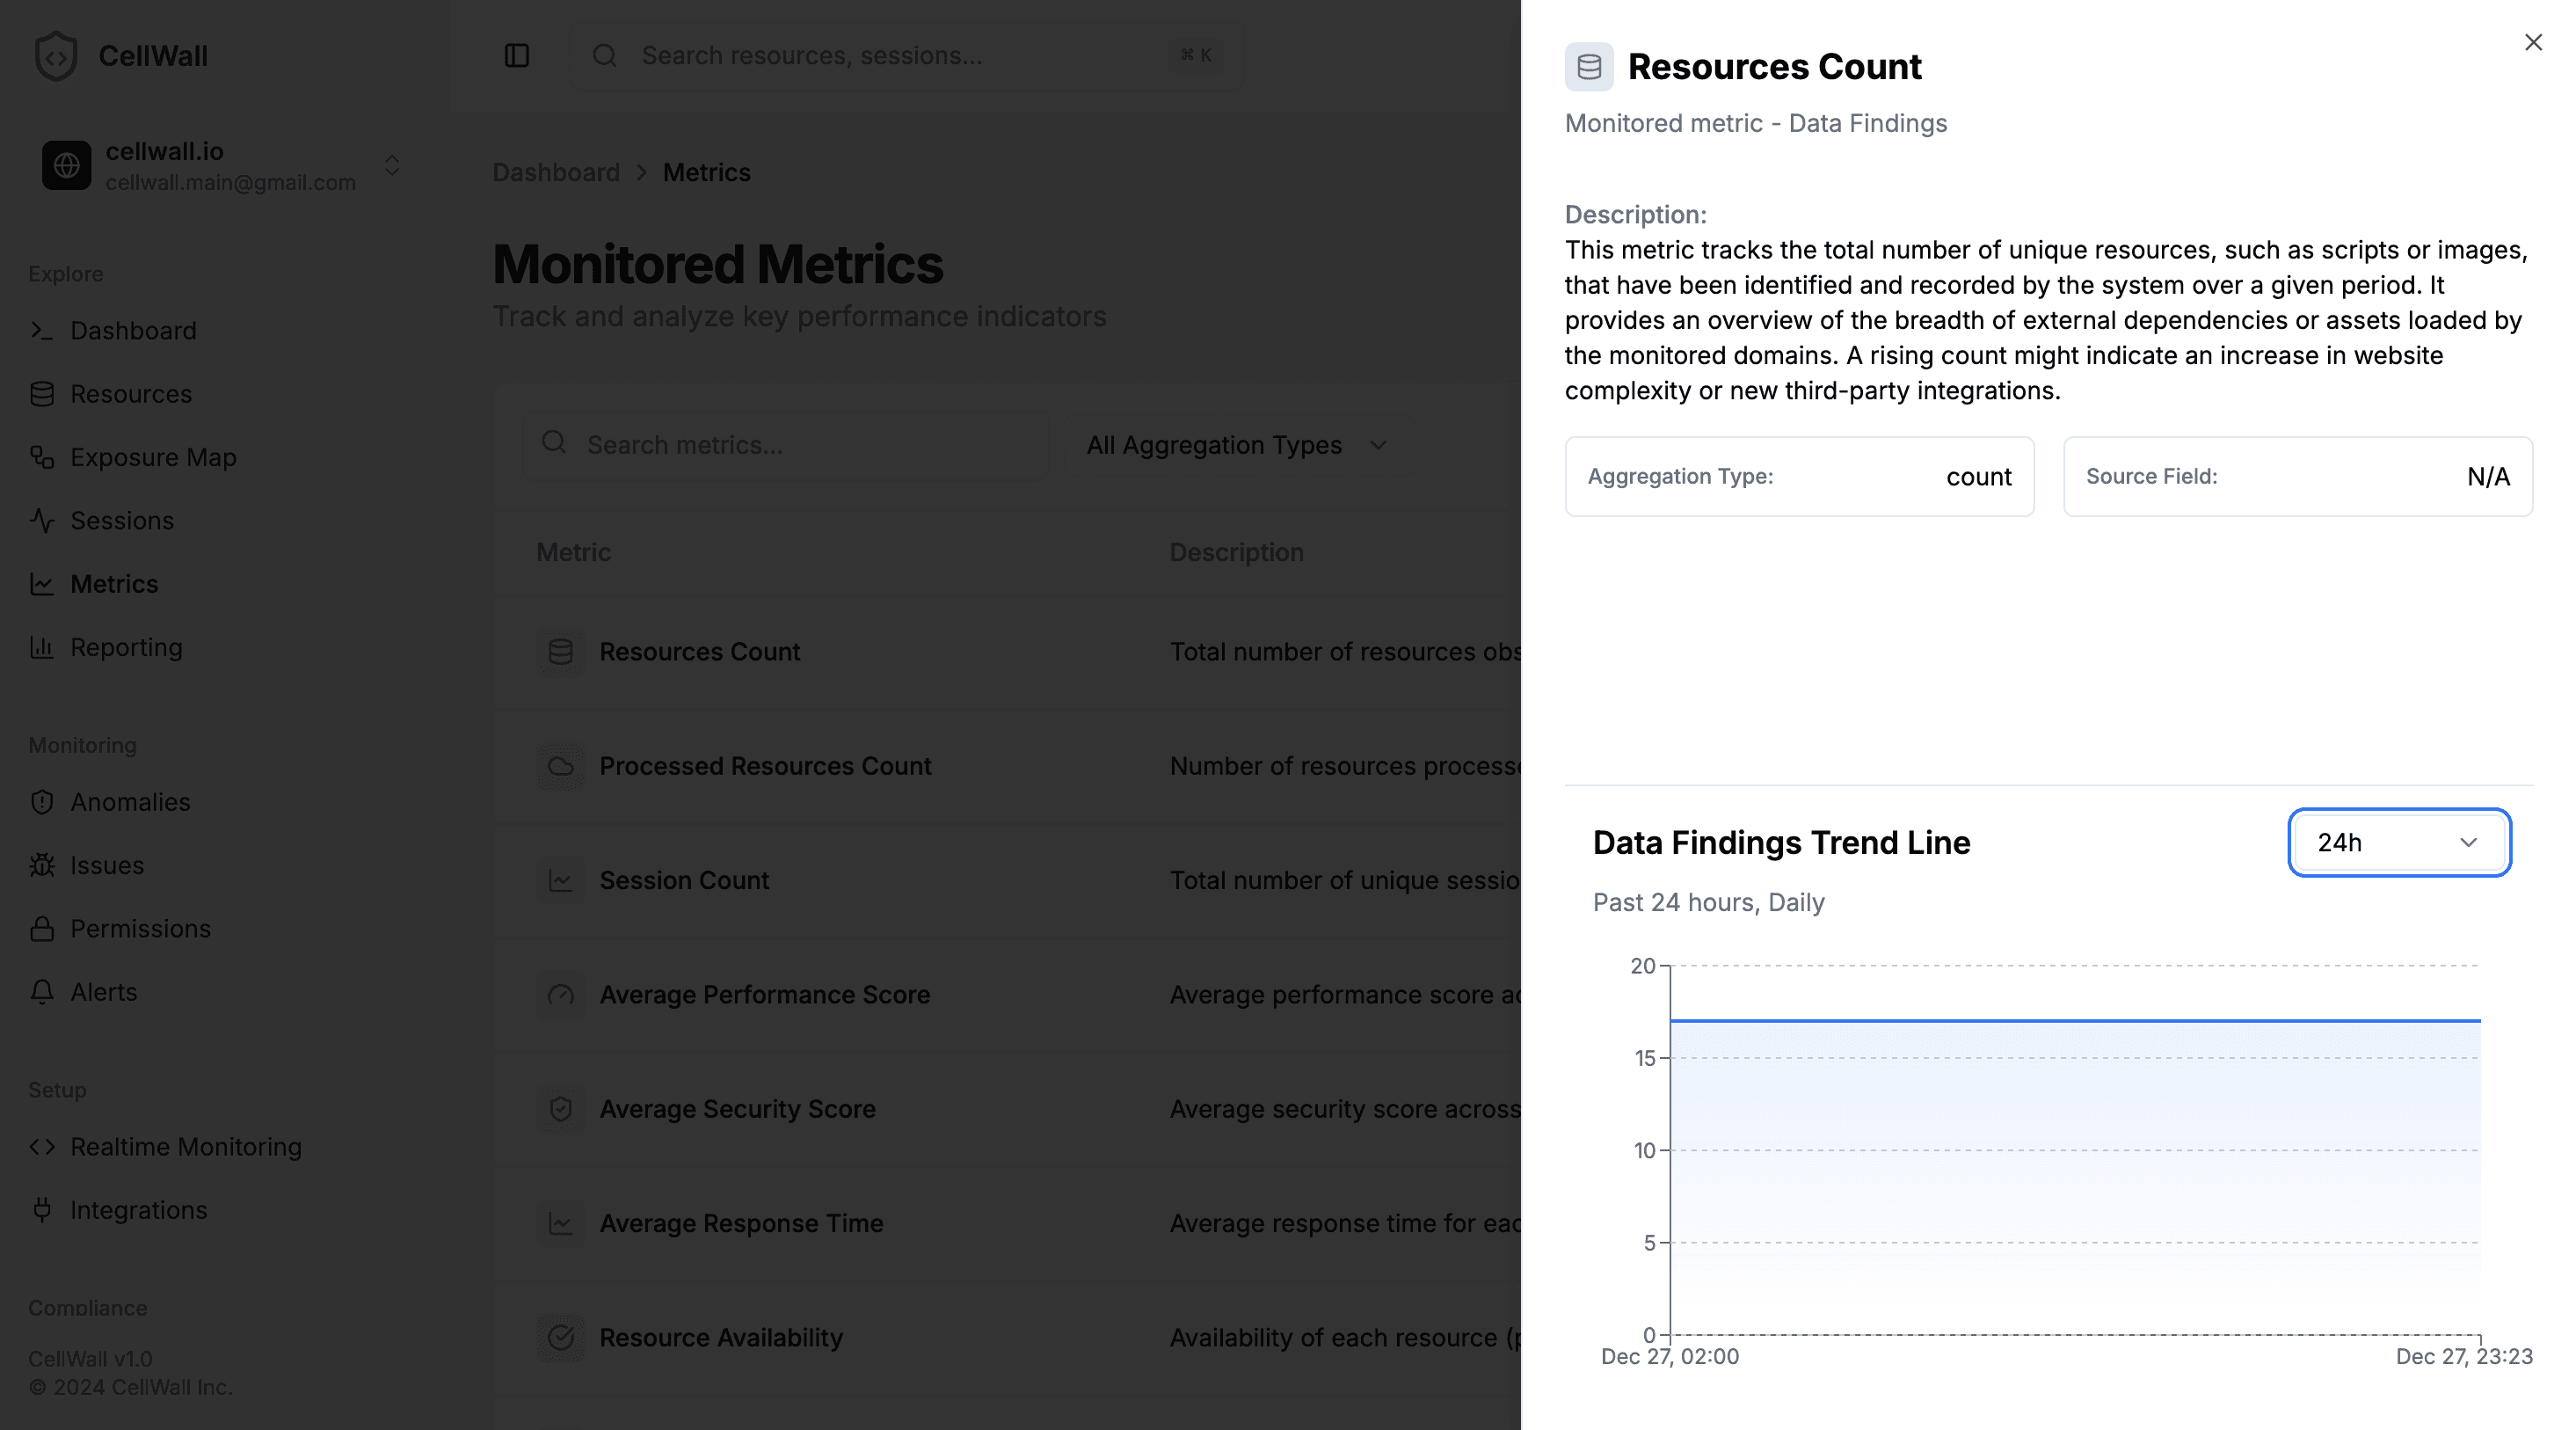
The platform metric detail view pairs a resource-count definition with its aggregation and available historical data.

Search the metric catalog and filter by aggregation type. Start with the question, then choose the metric that answers it.
Select a supported time window in the metric detail view. Inspect available series and their values instead of relying on a single summary number.
CONNECTED MEASUREMENTS
Review the available metric families together. A growing resource count, a changing response time, and an open issue are different signals, not interchangeable measures of risk.
Review resource counts, processed resources, and observed sessions to understand the scale of monitored activity. A change in activity can help explain a change in totals.
Explore available response-time, availability, error, and network-request measurements. Use them to identify where a third-party performance investigation should begin.
Read average security scores alongside active, total, and resolved issue counts. Averages summarize underlying resources; inspect the findings before drawing conclusions about a specific dependency.
Use available issue-status, severity, and closure-time metrics to review recorded work. Interpret closure timing in the context of the issue records, rather than as a complete incident-response SLA.
FROM TREND TO INVESTIGATION
A chart shows that a measurement moved. It does not, by itself, explain why. Continue into the relevant resource, provider, or available session records to inspect timing and captured activity. Keep the aggregate trend and the specific observation distinct.
The session-analysis animation illustrates inspecting individual request timings. It complements metric history; it does not represent automatic root-cause attribution.

Use available session and resource context to examine requests and timing around the activity you are investigating.
Consider issues and browser behavior alongside timing. A slow resource and a security finding may need different actions, even when they concern the same provider.
A PRACTICAL REVIEW LOOP
Bring a consistent question, time window, and metric definition to each review so the discussion leads to an informed next step.
Are resource counts growing, response times changing, or issues remaining open? Select the metric and aggregation that fit the question instead of treating one score as an overall verdict.
Review the selected time window and series. Check whether activity, monitoring scope, or the mix of resources has changed before comparing values.
Inspect the relevant resource or finding, involve the responsible team, and revisit the available measurements after an action. A later improvement is a useful observation, not proof of causation.
Continue from a measurement into the workflow that helps explain it.
Explore how metrics fit with SiteWall inventory, browser monitoring, and policy controls.
Investigate third-party timing and reliability in the context of a website integration.
Identify the providers and individual resources behind the monitored website.
Examine captured browser activity, issues, and anomalies behind an aggregate trend.
Practical questions
It uses available resource timing and related measurements to examine third-party delivery and execution. SiteWall combines metric history with resource and browser context so teams can investigate performance observations alongside security findings.
The catalog includes resource activity, performance, security scores, and issue measurements. Definitions show what a metric represents and how it is aggregated. Historical results depend on the data available for the selected project and period.
The metric detail view supports 6 hours, 24 hours, 3 days, and 7 days. The chart displays available data for that window; selecting a period does not guarantee that observations exist throughout it.
It summarizes resource scores, which are based on triggered rules. Use the average as a review signal and inspect individual findings. It is not an exploitability assessment or a complete measure of website risk.
Not on its own. Timing is an investigation input. Review the resource, available session activity, and surrounding context before attributing a website slowdown to a particular script.
No. Metrics provide measurements and history. Alert policies separately evaluate new issues or anomalies against configured count thresholds. A movement in an arbitrary chart is not automatically a notification trigger.
This workflow focuses on available browser-resource and security observations. It does not claim full backend tracing, business-transaction attribution, or complete coverage of every visitor interaction.
Use the same metric definition and comparable periods, and check monitoring scope and activity. Counts, averages, and distributions describe different things. Review the underlying context before treating a change as an improvement or regression.
Explore defined metrics, inspect available history, and bring browser evidence to your next security or performance review.