
Access
Browser API use
See recorded use of supported APIs, including cookie access, local storage and browser capabilities. Connect an access event to its initiating resource and session to understand how the script interacts with the browser.
JavaScript security monitoring
SiteWall by CellWall is a client-side security and third-party script governance platform. Its JavaScript security monitoring connects supported browser API use, network requests, errors and execution timing with resource and session context, helping security and engineering teams investigate behavior, review findings and make informed decisions about browser permissions.

A script inventory tells you what is present. Script behavior monitoring helps explain what that code did after loading. When a familiar resource accesses a browser API or contacts a destination, its runtime record gives your team a starting point for investigation.
The Logs Explorer walkthrough opens an API-use event, then expands metadata to show the API name and initiating script.

Review the recorded event type, timestamp, resource identifier and session context instead of treating an API call as an isolated signal.
Expand a log record to inspect available metadata, including the API name or request details. Use the initiating resource to continue your investigation.
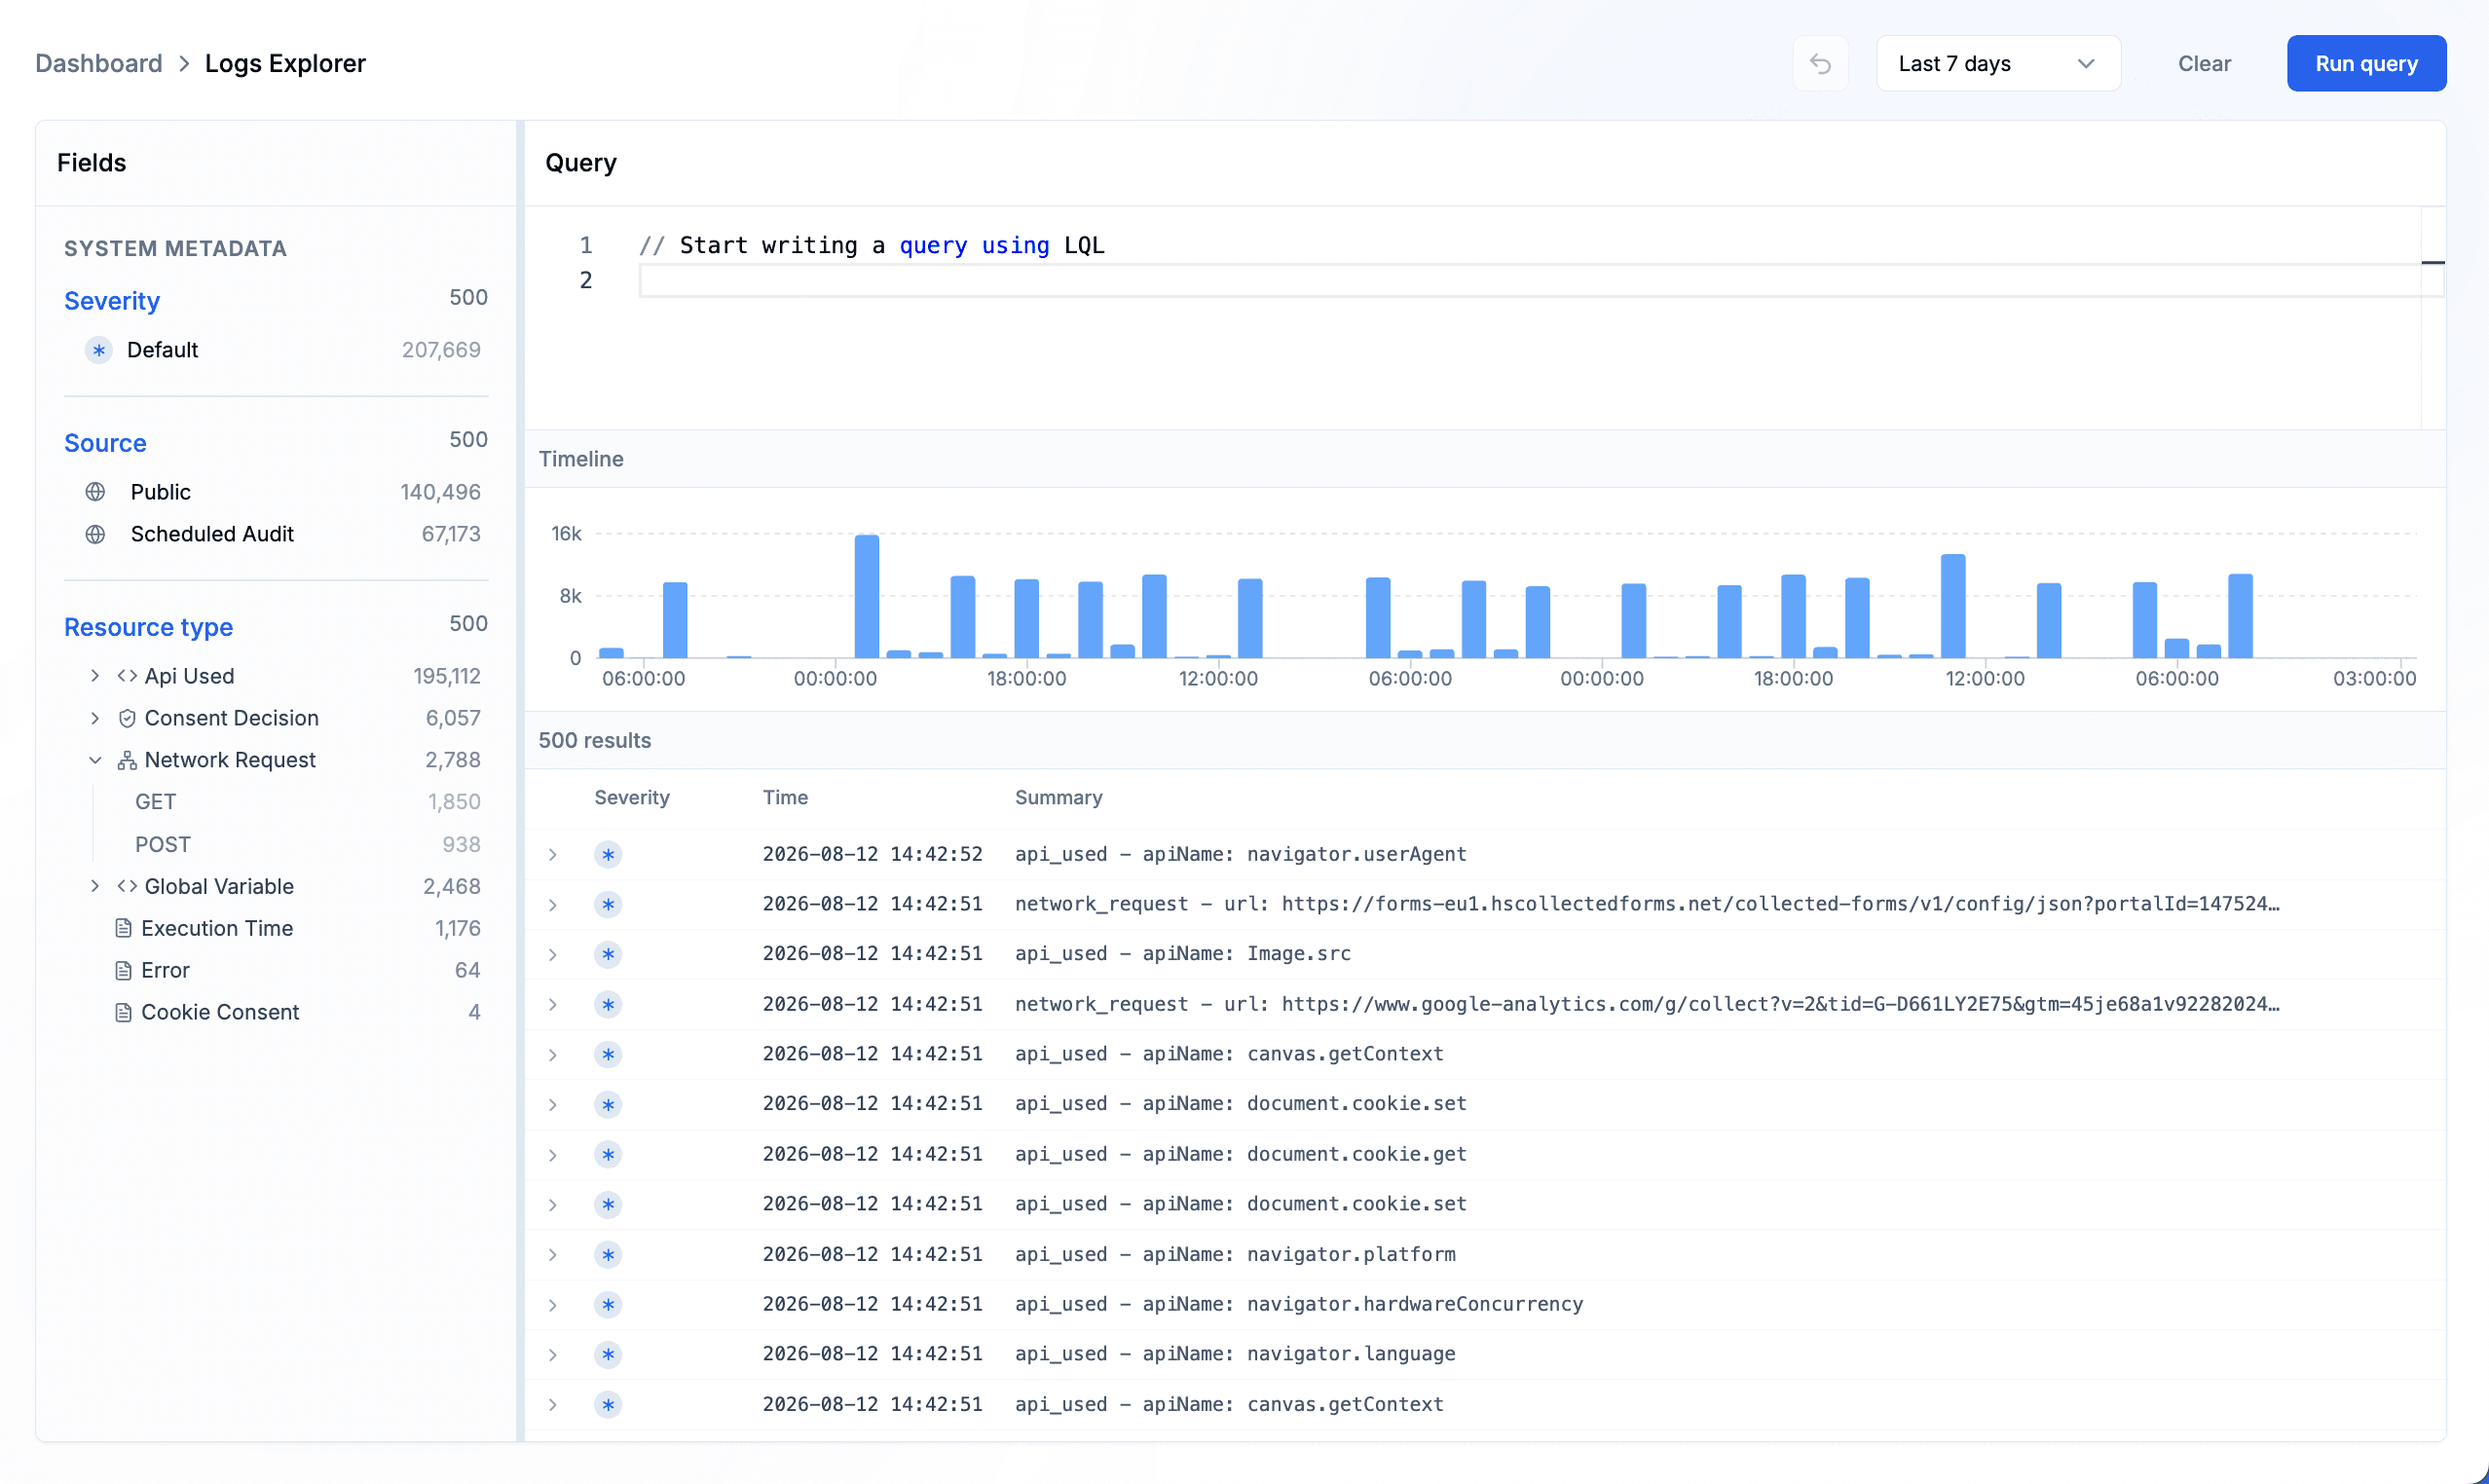
Browser behavior
Browser API access monitoring and network telemetry answer different questions. Read them together with JavaScript errors and execution timing to understand what deserves a closer look.
See recorded use of supported APIs, including cookie access, local storage and browser capabilities. Connect an access event to its initiating resource and session to understand how the script interacts with the browser.
Inspect captured request destinations and available request metadata for instrumented network operations such as fetch and XMLHttpRequest. Compare an unexpected connection with the script’s purpose before deciding whether a network restriction is appropriate.
Review captured error messages and available stack information. Use resource and session context to narrow the investigation and identify the script involved.
Review recorded script execution timing alongside errors and resource behavior. Use these signals to identify resources that merit a closer look and guide your engineering investigation.
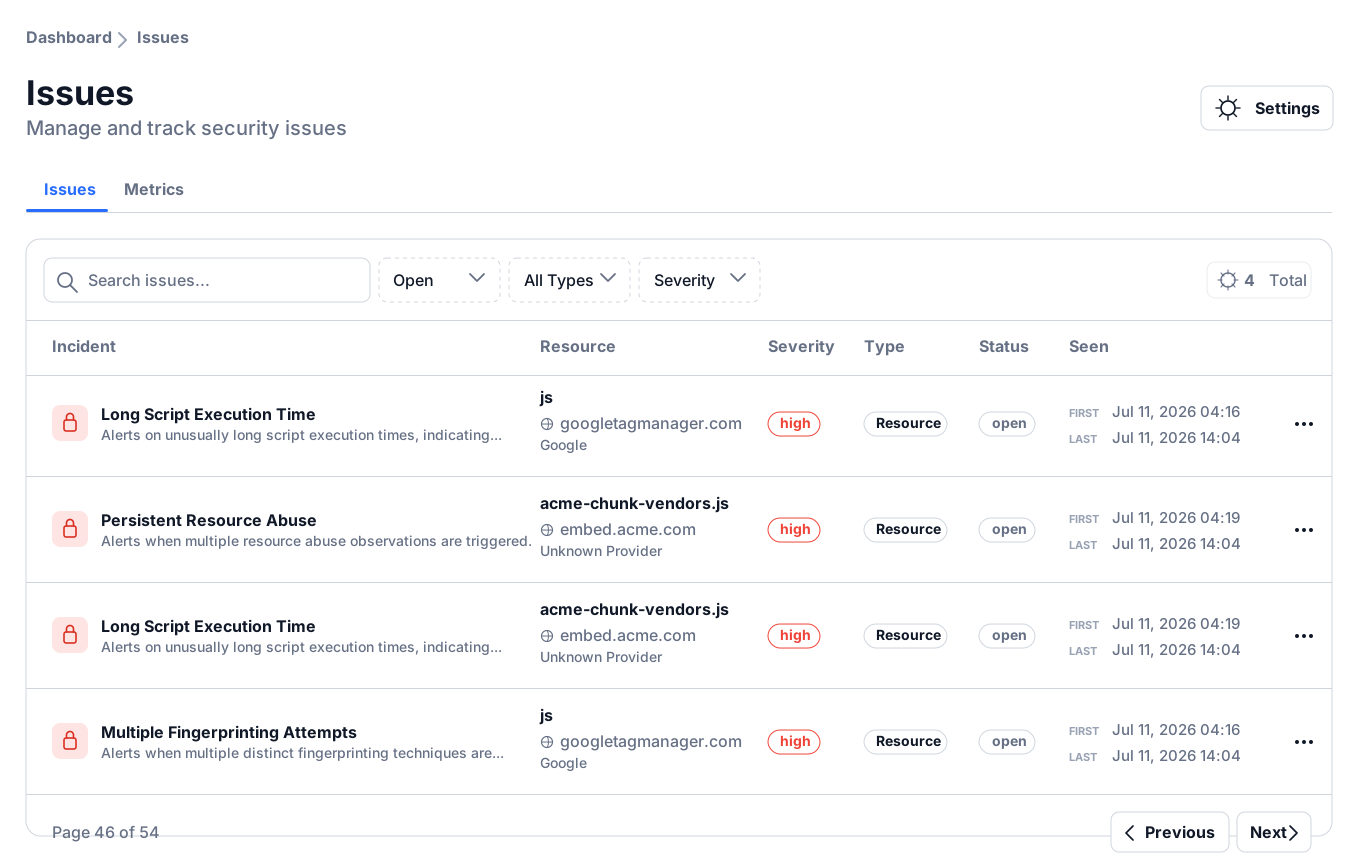
A log records what happened. An issue or anomaly gives your team a finding to review. Move from the finding’s description and severity to its resource context, then inspect the available session evidence before deciding what needs attention.
The platform walkthrough opens an issue, examines an anomaly, and follows it into its associated sessions.

Search and filter issues by severity, type, and status. Inspect the affected resource and finding description, and record a resolution when the review is complete.
Review rule-based findings about browser behavior and timing. Use anomaly settings to select enabled rules and presets, so the monitored signals reflect the behaviors your team wants to investigate.
ALERTS & INTEGRATIONS
Keep collection, investigation, and notification connected. Alert policies evaluate new issues or anomalies against a configured count threshold, then send a summary through the channels you have set up.
Create an alert policy for issues or anomalies, set its count threshold, choose recipients, and enable or disable the policy. Notifications follow policy evaluation; they are not a separate alert for every raw browser event.
Deliver notifications through email, Slack, Microsoft Teams, or Discord when the corresponding channel is configured. Messages include finding summaries and severity, with links back to the relevant finding and resource for investigation.
Use alert history and delivery status to check whether a notification was sent or failed. Open the linked evidence to investigate, then decide whether to adjust a policy or resolve the finding. Notification alone does not change browser permissions.
From observation to action
Monitoring is the evidence layer. Use it to inform a review, a configured alert or a policy change without treating observation and enforcement as the same operation.
Bring the event, resource and session context into a security or engineering review. Separate expected functionality from an unexplained change before choosing a response.
Configure alerts around issue or anomaly count thresholds and supported notification channels. Review delivery history; a captured runtime event is not automatically an alert.
Use observed behavior to inform provider or resource policies and supported browser capability controls. Check legitimate dependencies before limiting access, then review subsequent observations.
Monitoring in practice
Useful runtime JavaScript security starts with a clear monitoring scope. Establish where capture is active and which behaviors your team expects to review.
Validate the deployed instrumentation on the pages and journeys you want to monitor. Confirm that expected resources and event types appear in the platform. Browser observations reflect the activity captured in that configuration, not every possible visit or code path.
Keep the event timestamp, session and resource together. Capture, processing and notification delivery are separate stages. Evaluate browser observations alongside application diagnostics to distinguish unexpected behavior from expected functionality.
Continue from runtime visibility into the next part of your browser-security workflow.
See how runtime observations connect to resource visibility and browser controls.
Configure notifications and follow findings into an incident review.
Explore the connections that bring findings into your team’s workflow.
Apply granular browser permissions after reviewing the observed behavior.
Practical questions
JavaScript security monitoring examines supported script activity in the browser, such as API use and network requests. SiteWall associates captured telemetry with resource and session context so teams can investigate behavior and use the evidence in policy reviews.
An inventory describes observed resources and providers. Runtime monitoring adds evidence about supported operations while code executes. The two are complementary: presence identifies what to review, while behavior helps explain the access and connections involved.
Supported instrumentation records browser API-use events, network requests, JavaScript errors and execution timing. Available fields and coverage depend on the event, capture path and deployed configuration.
The workflow shown here is browser telemetry investigation, not a visual recording of a visitor’s session. Error and timing records can help engineering investigate a resource, but they do not replace full application performance monitoring, backend traces or business-impact analysis.
No. Runtime activity is captured as supported operations execute, while processing and notification delivery happen separately. Alerts evaluate configured issue or anomaly count thresholds and use the selected delivery channel.
No. An observation and a policy decision are separate. Provider, resource, browser-capability and network controls determine configured enforcement for supported operations. Use the recorded behavior to review those controls and the legitimate functionality they need to preserve.
Choose a representative page or journey, confirm capture is active, and inspect the resources and event types that appear. Open a record, check its metadata and session context, and work through one investigation with your security or engineering team.
Issues are findings your team can review by severity, type and status. Anomalies are rule-based findings about browser behavior or timing. An alert is a notification triggered when new issues or anomalies exceed a configured count threshold; it points your team back to the findings for investigation.
Create an alert policy for issues or anomalies, set a count threshold, choose recipients and enable the policy. Configure the delivery channel and review alert history to check whether notifications were sent or failed.
Configured notifications can be delivered through email, Slack, Microsoft Teams and Discord. Messages include finding summaries, severity and links back to the relevant finding and resource, so teams can continue the investigation in SiteWall.
Explore how browser observations can help your team investigate a resource and decide what access it should have.