Secure Your Front-end

Request a Demo

Join the leading security teams protecting their digital supply chain with CellWall.

By submitting this form, you agree to our privacy policy and terms.

Chart library

Use the findings with context intact

Download each chart in publication-ready PNG or editable SVG format with its qualification.

Charts are 1600 × 900 and designed for articles, briefings, and social posts.
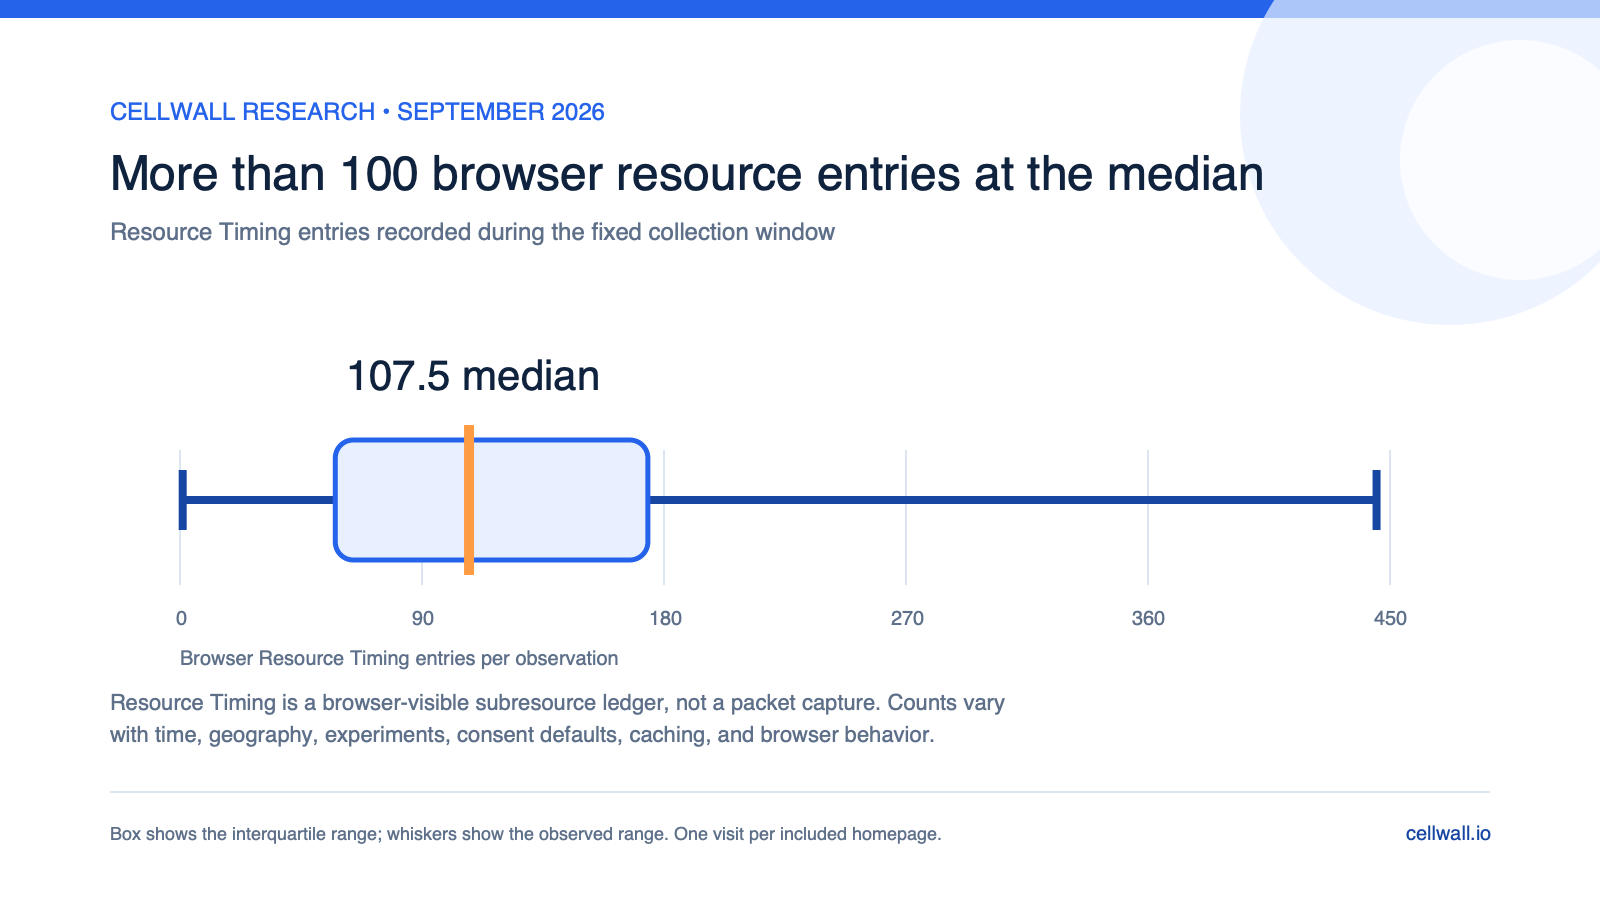
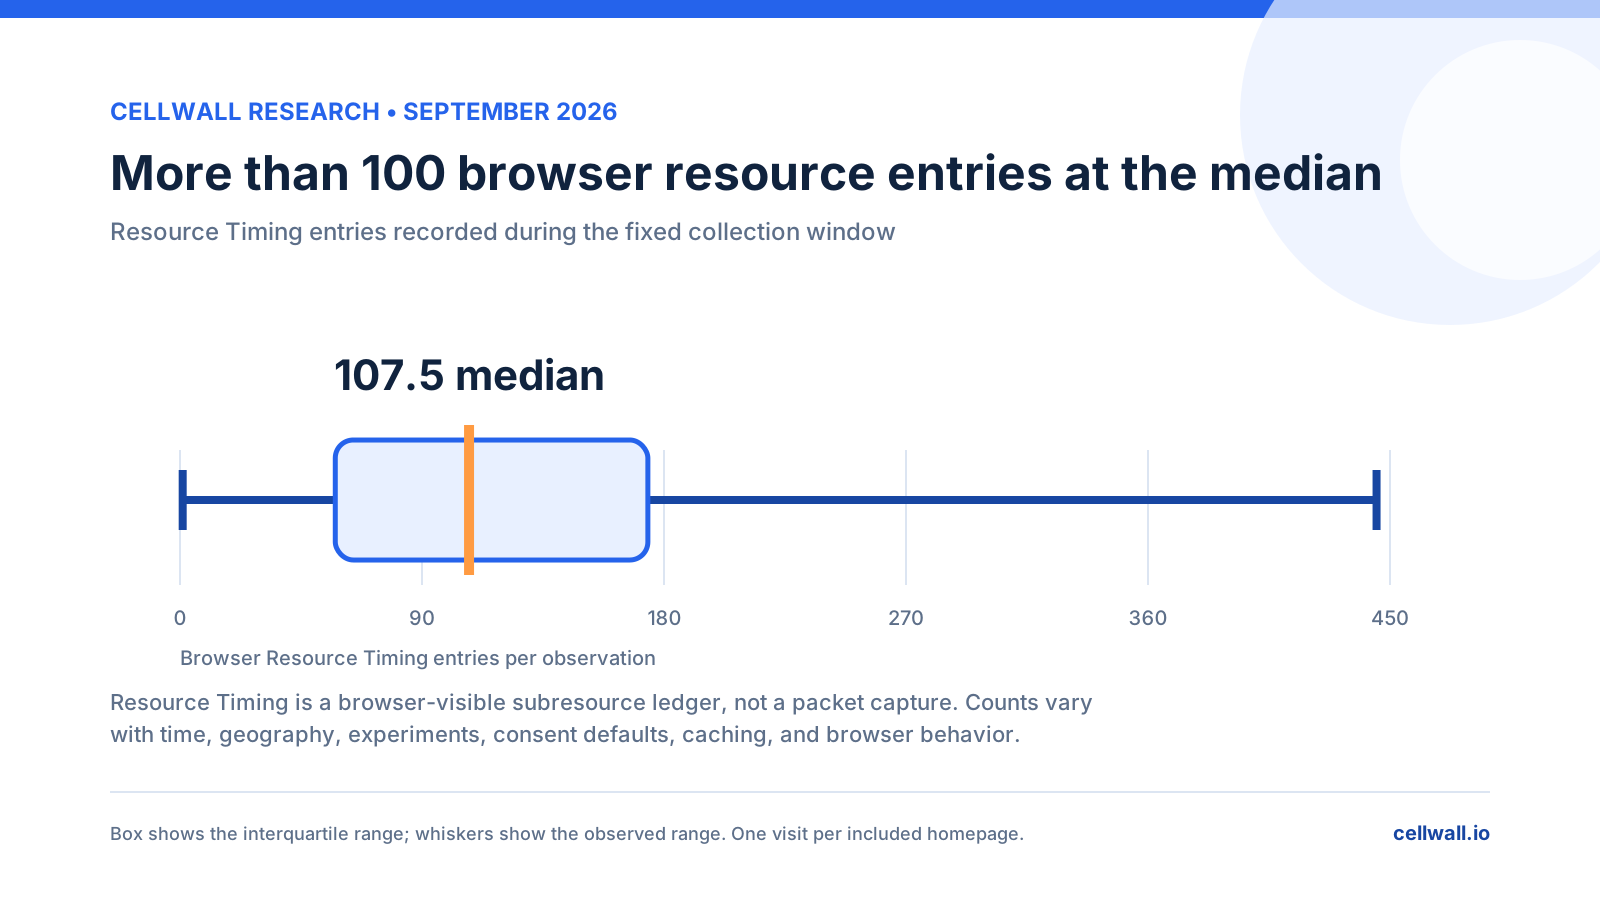
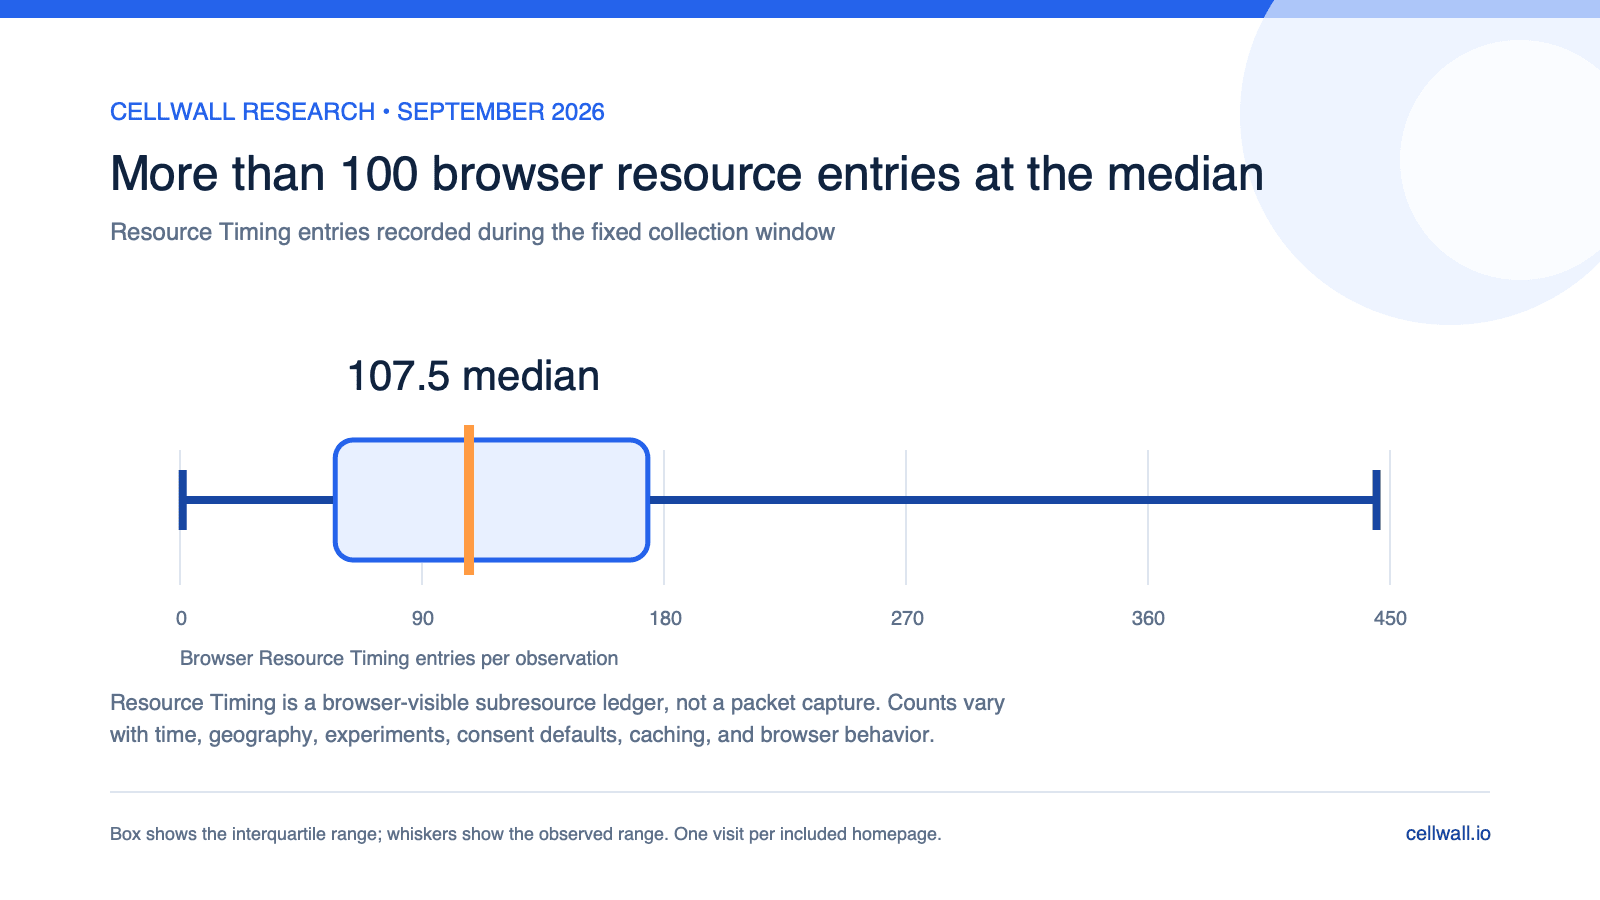
Box plot showing a median of 107.5 Resource Timing entries per observation

Browser resource entries

Resource Timing is a browser-visible subresource ledger, not a packet capture. Counts can vary with browser and collection conditions.

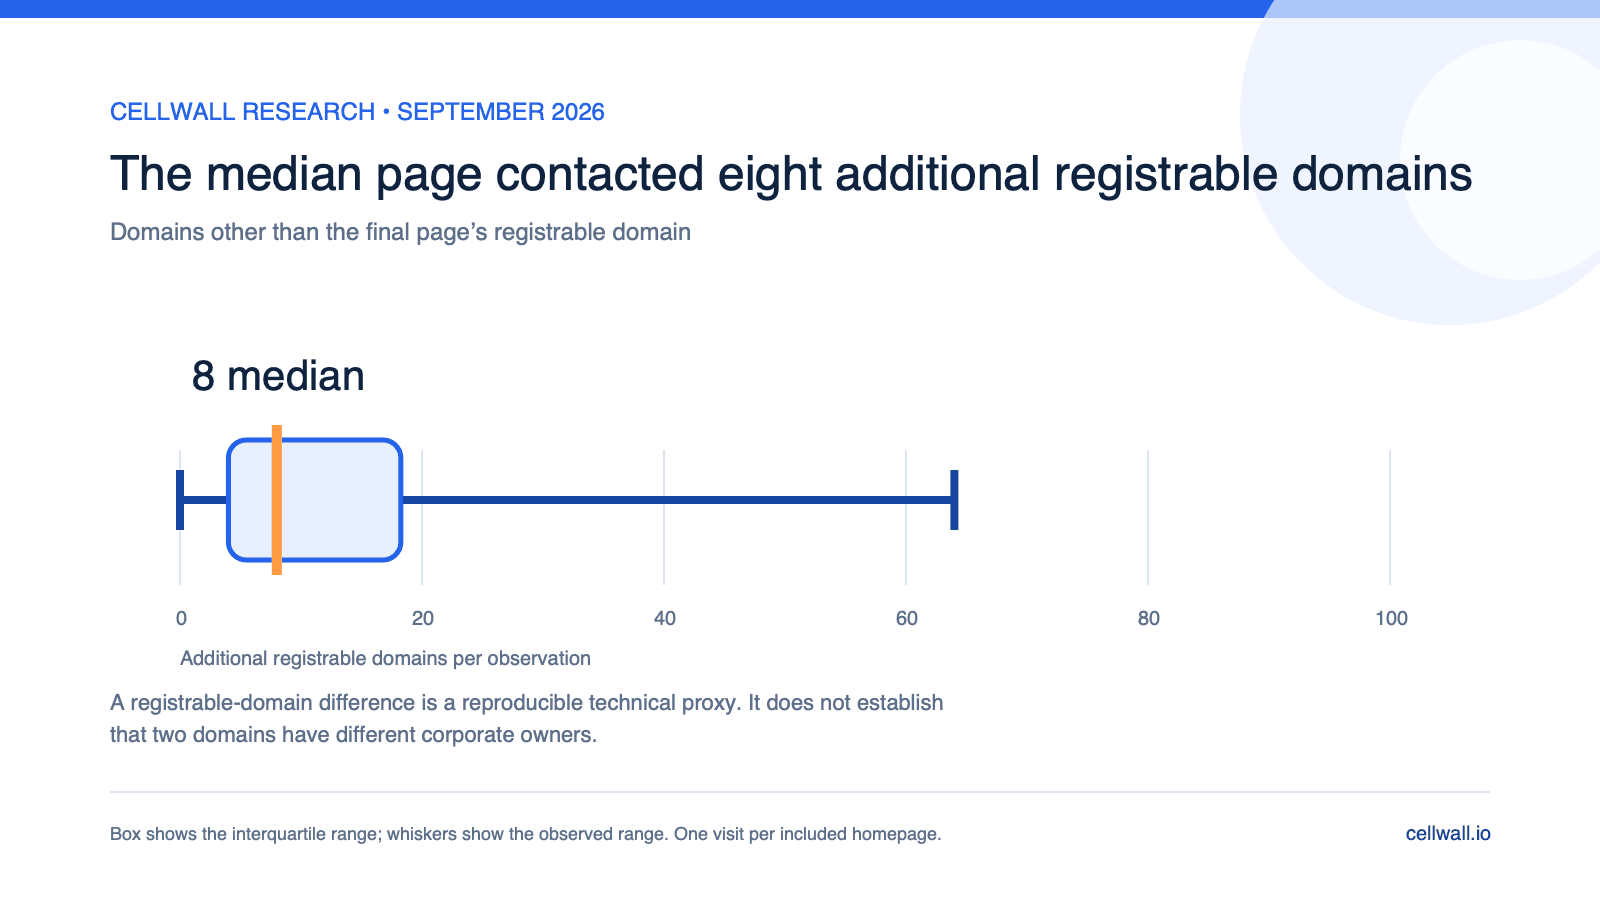
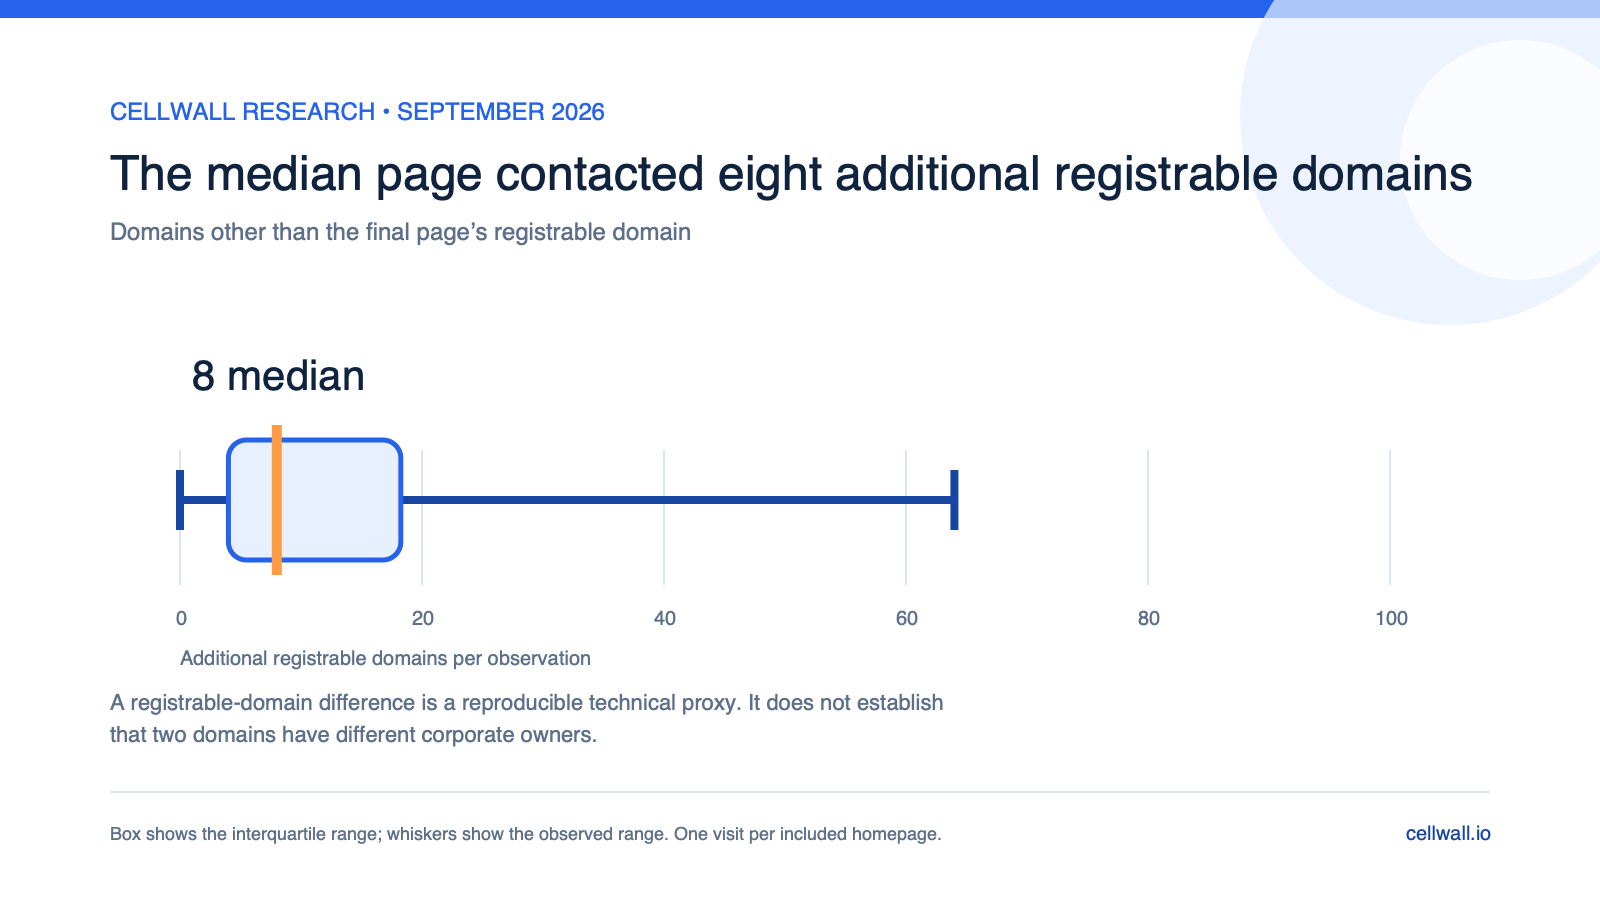
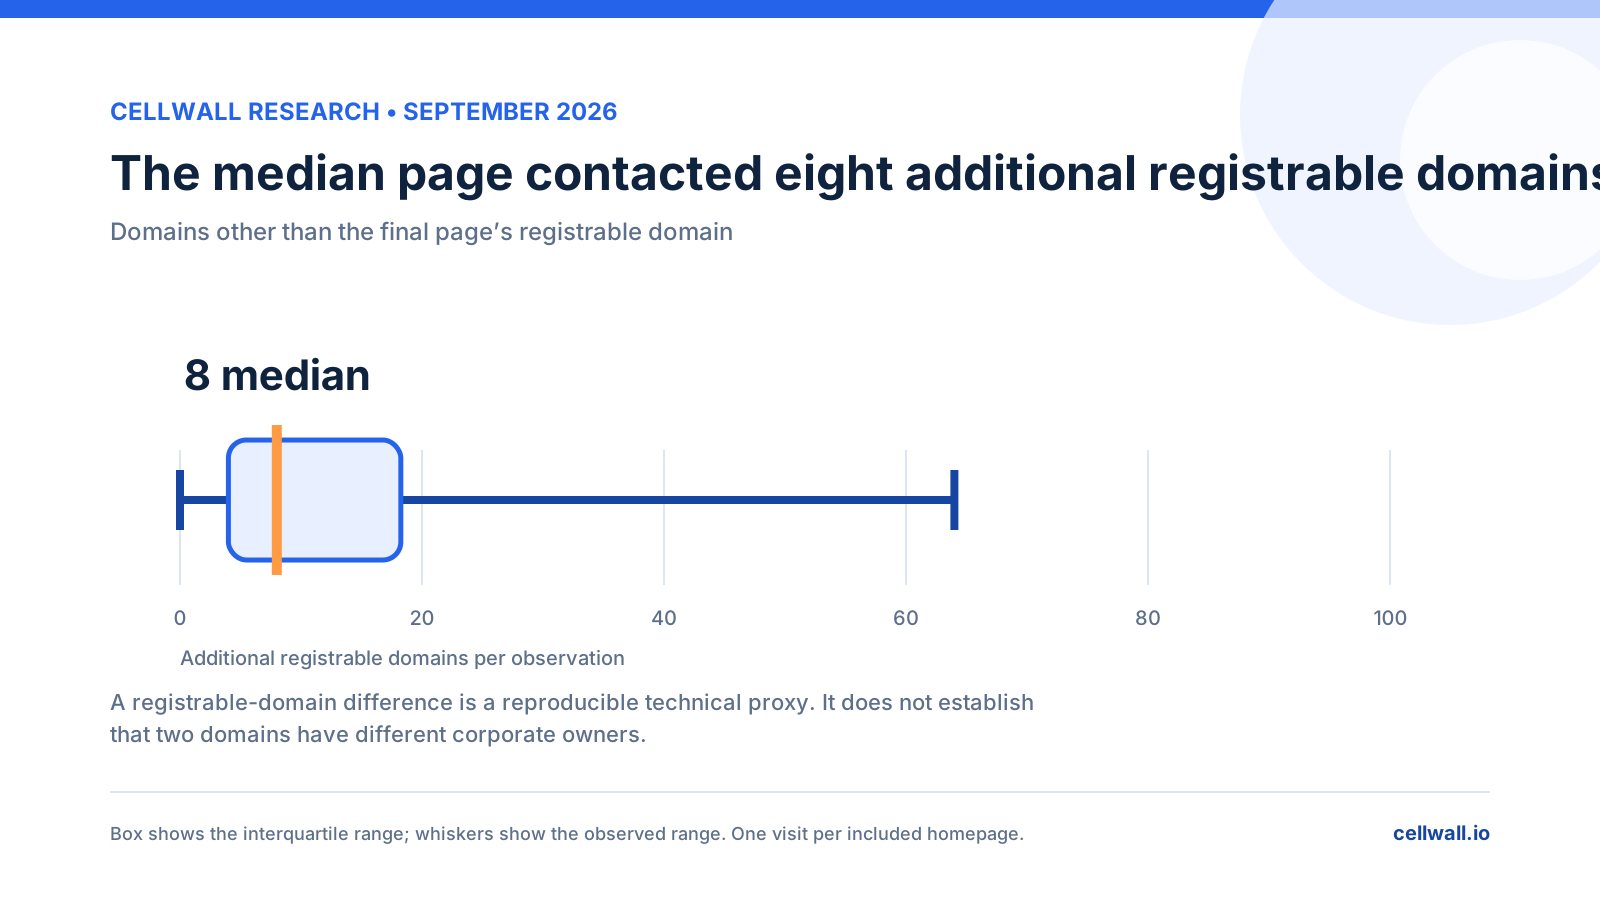
Box plot showing a median of eight additional registrable domains per observation

Additional registrable domains

A registrable-domain difference is a reproducible technical proxy. It does not establish different corporate ownership.

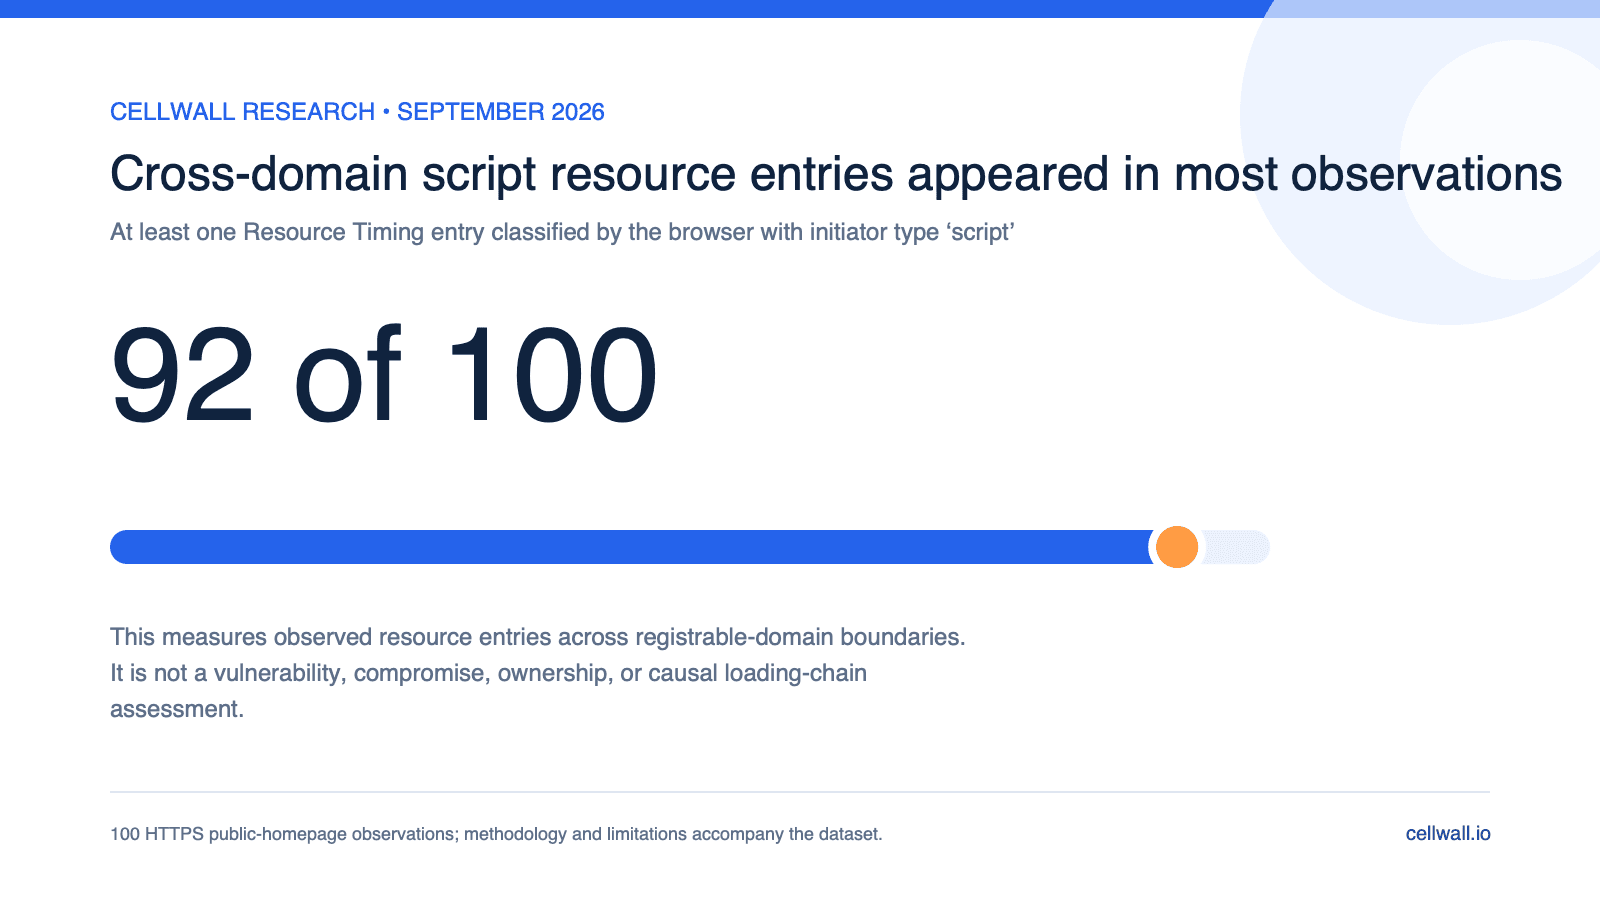
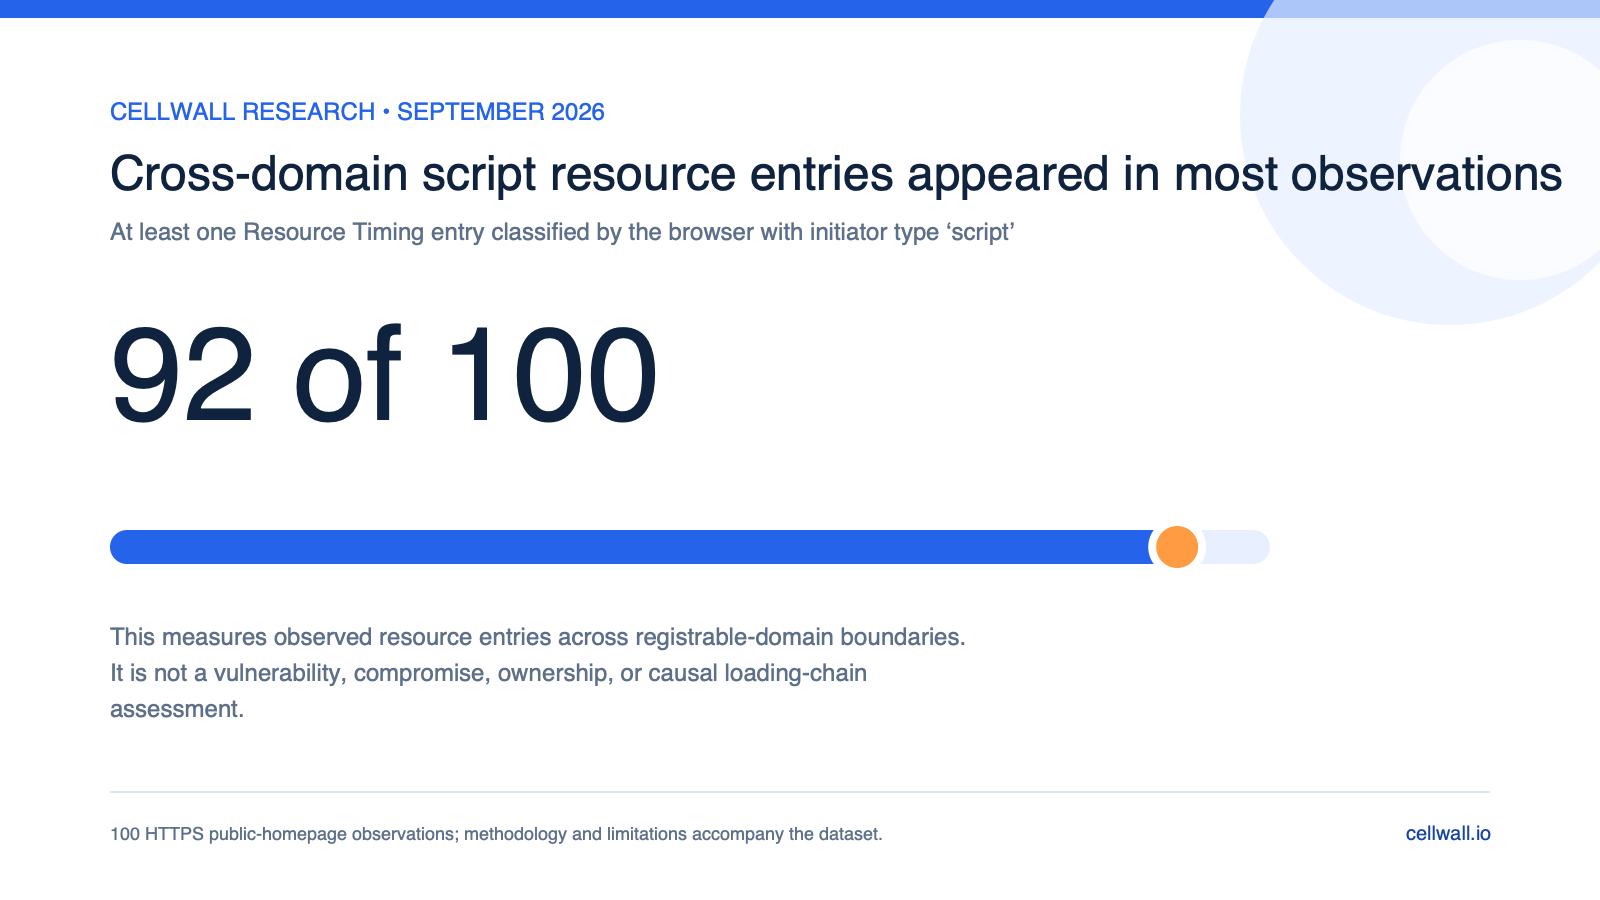
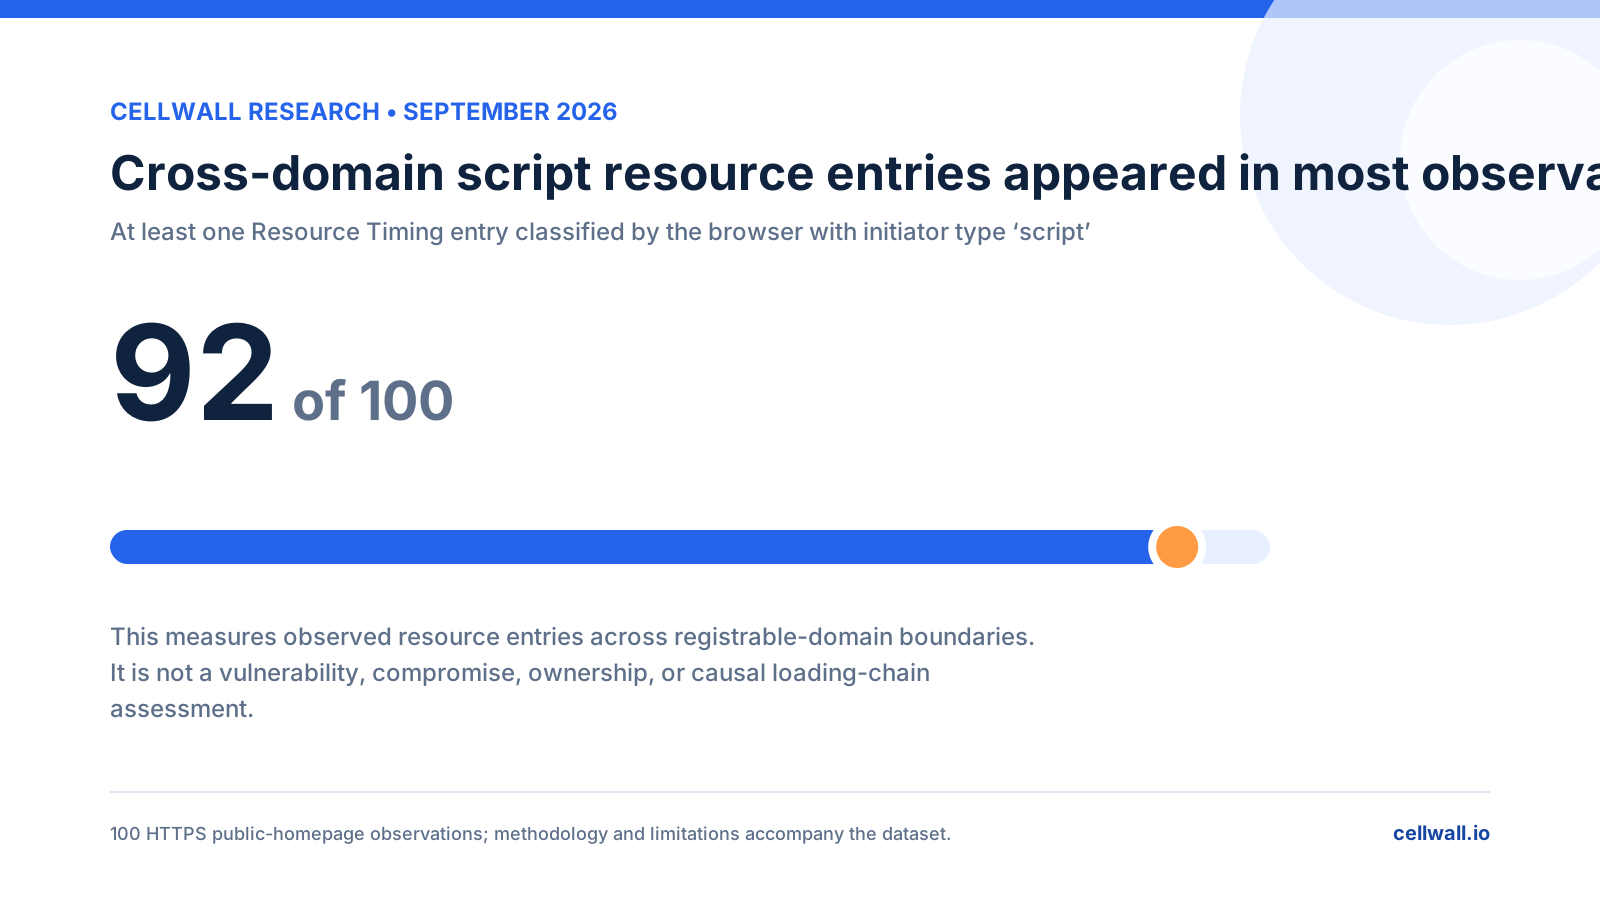
Chart showing cross-domain script resource entries in 92 of 100 observations

Cross-domain script resource entries

This is not a vulnerability, compromise, ownership, or causal loading-chain assessment.

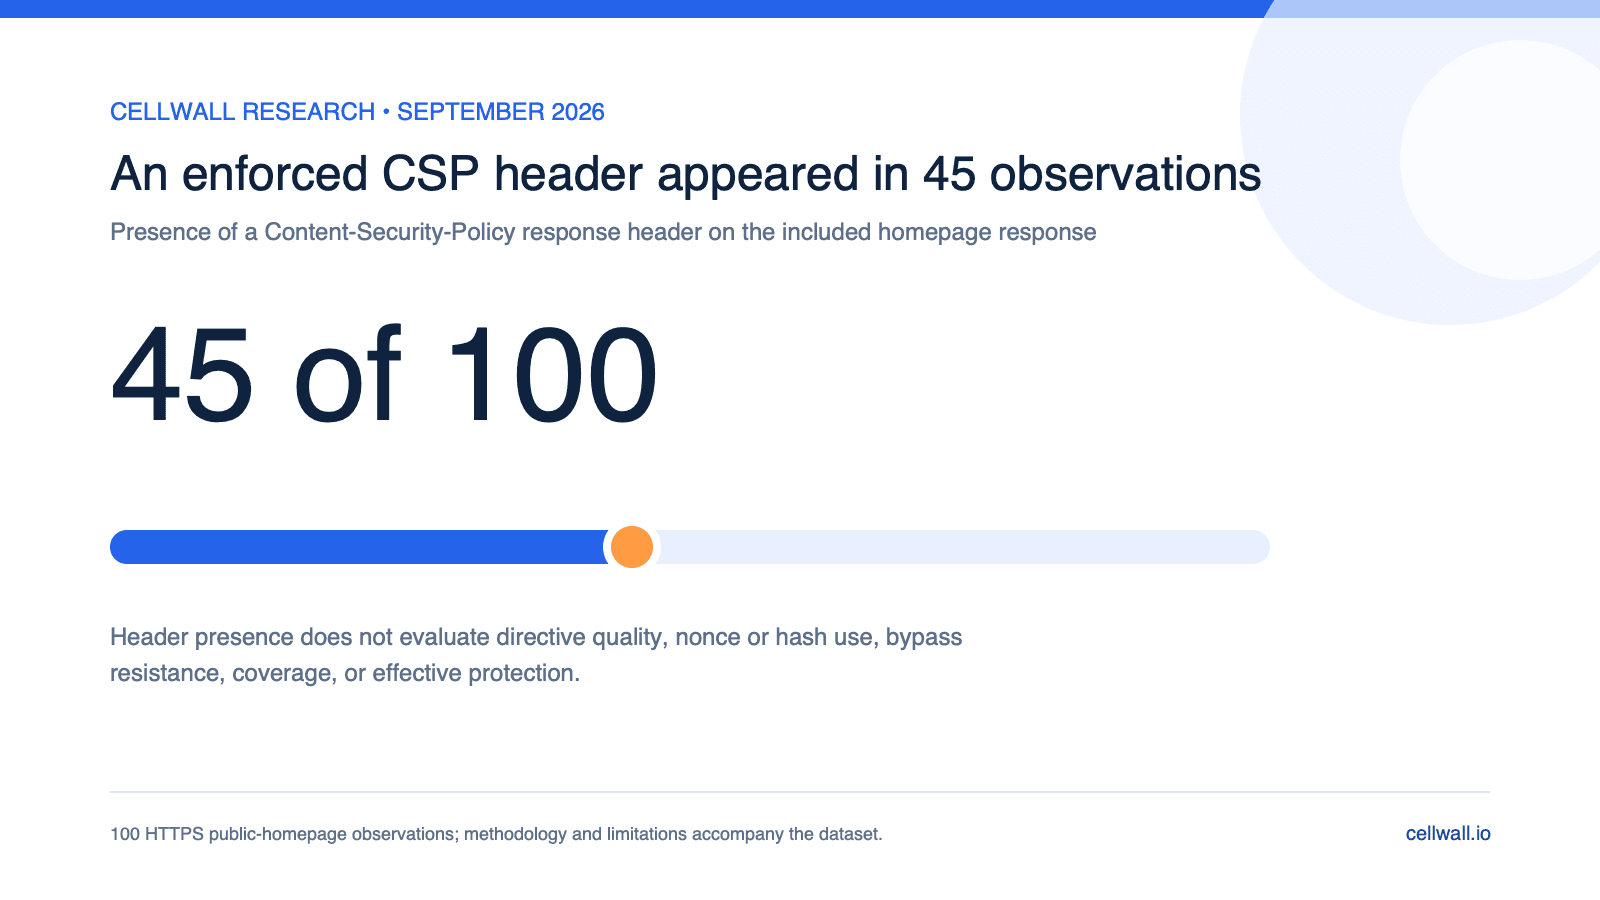
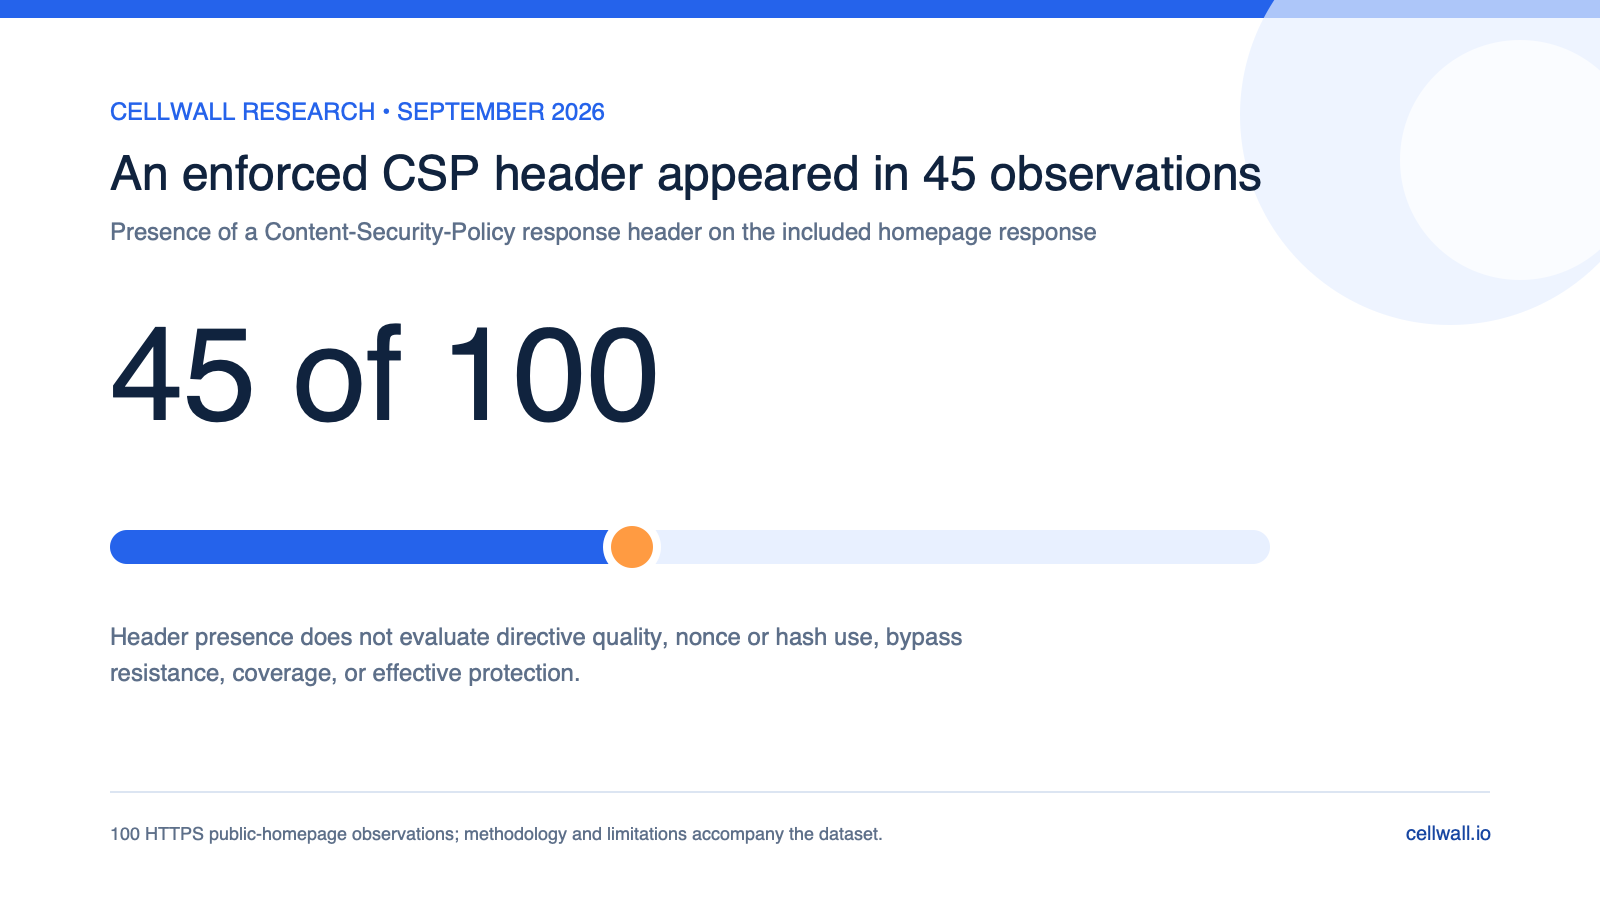
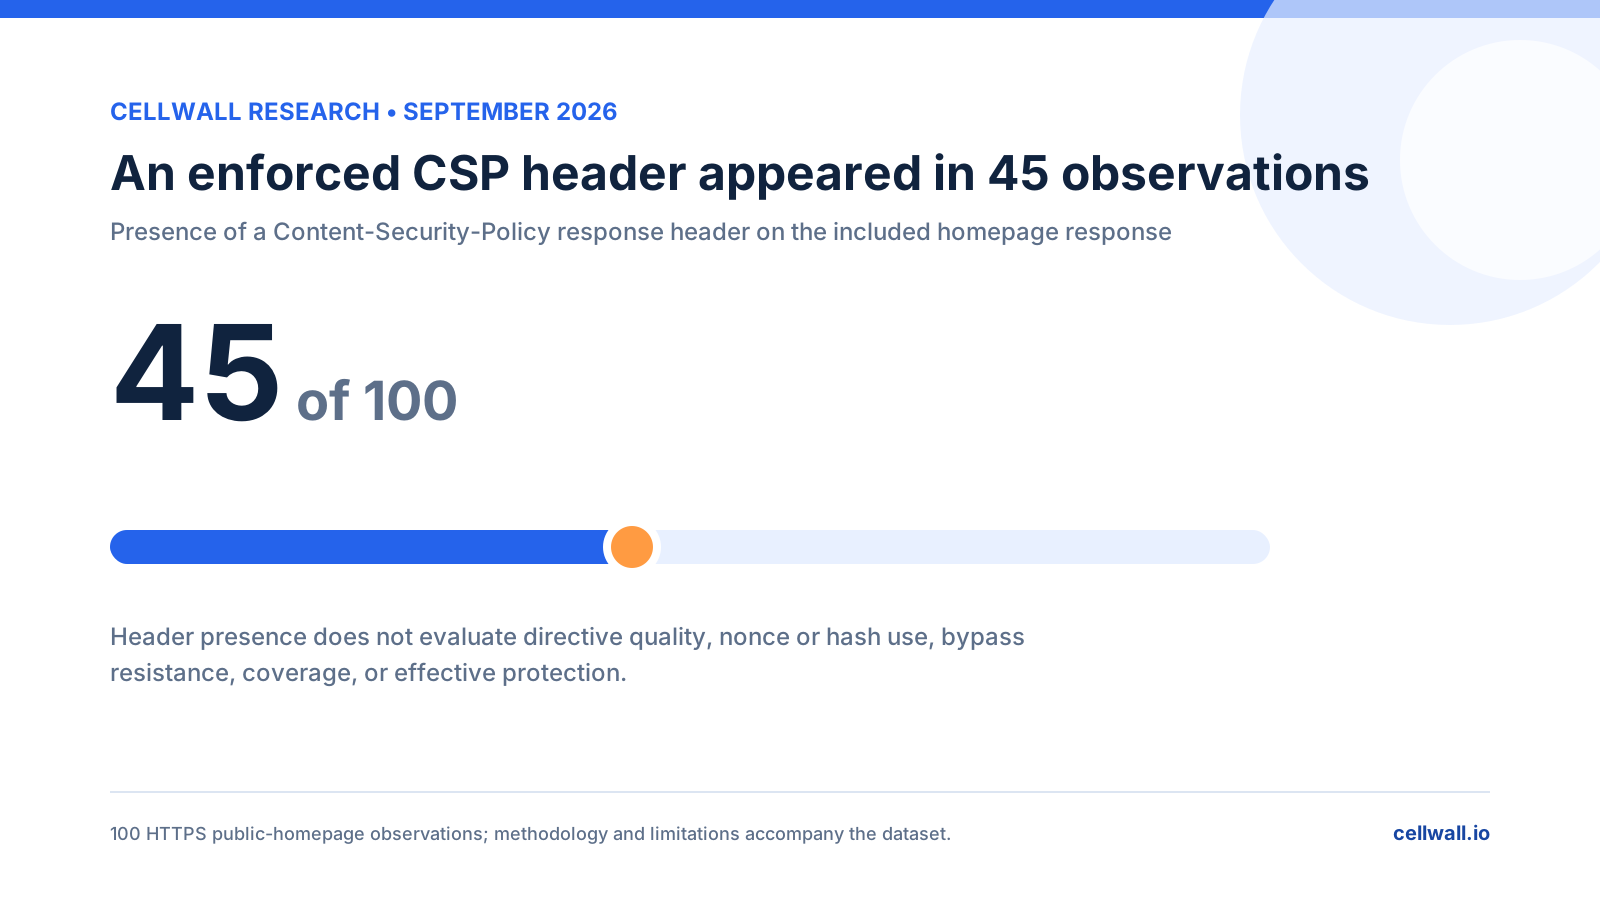
Chart showing an enforced Content-Security-Policy response header in 45 of 100 observations

Enforced CSP header presence

Header presence does not evaluate directive quality, nonce or hash use, bypass resistance, coverage, or effective protection.

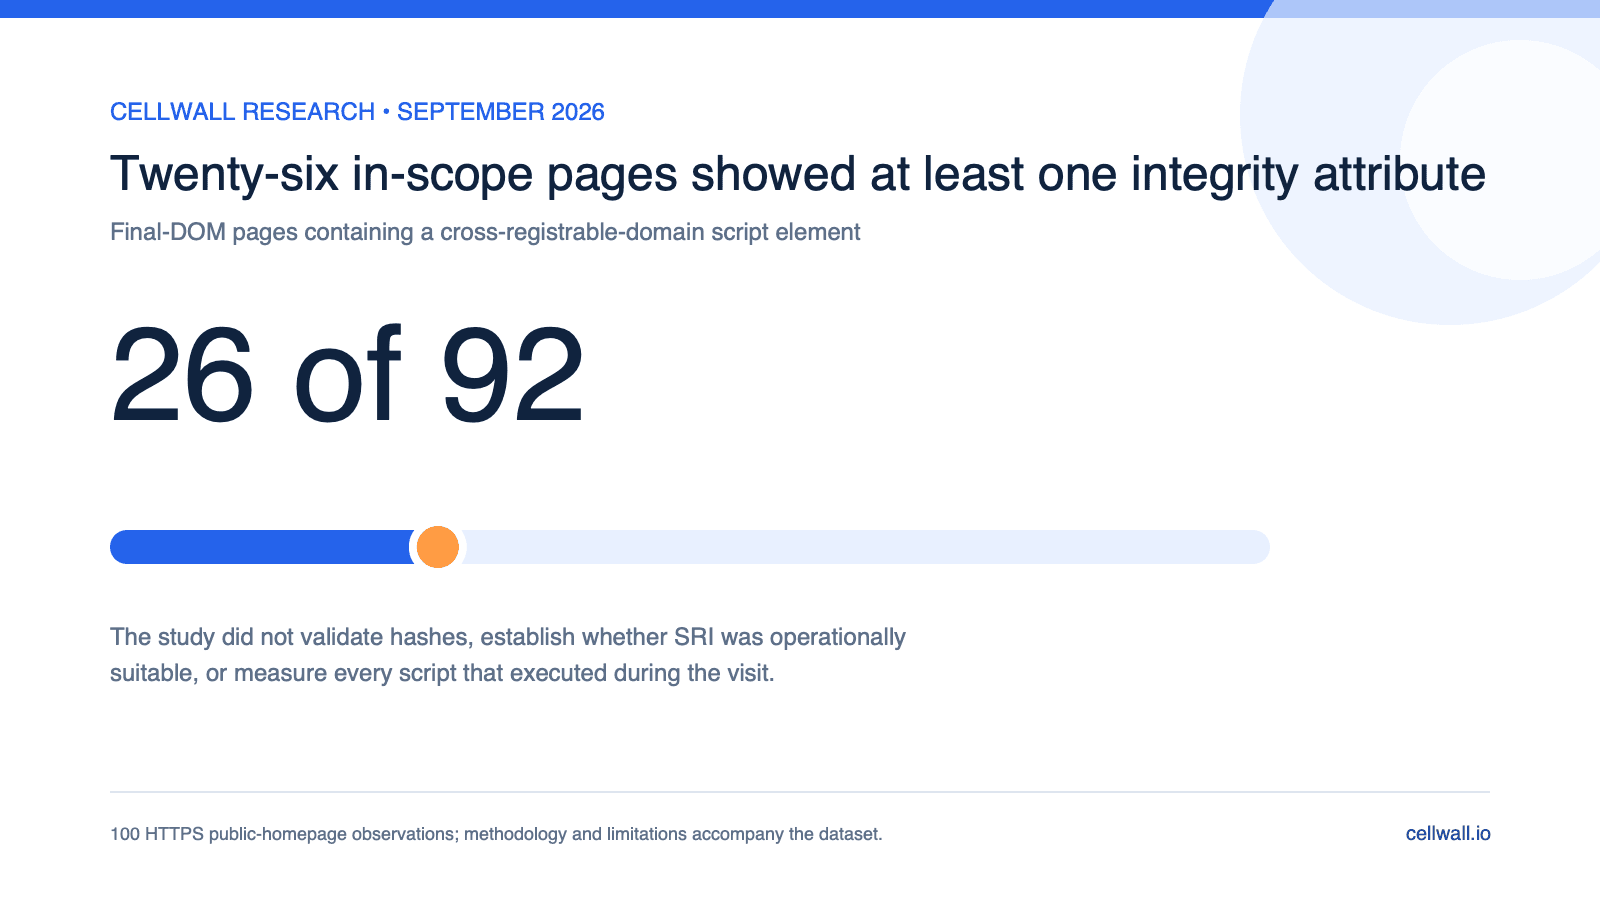
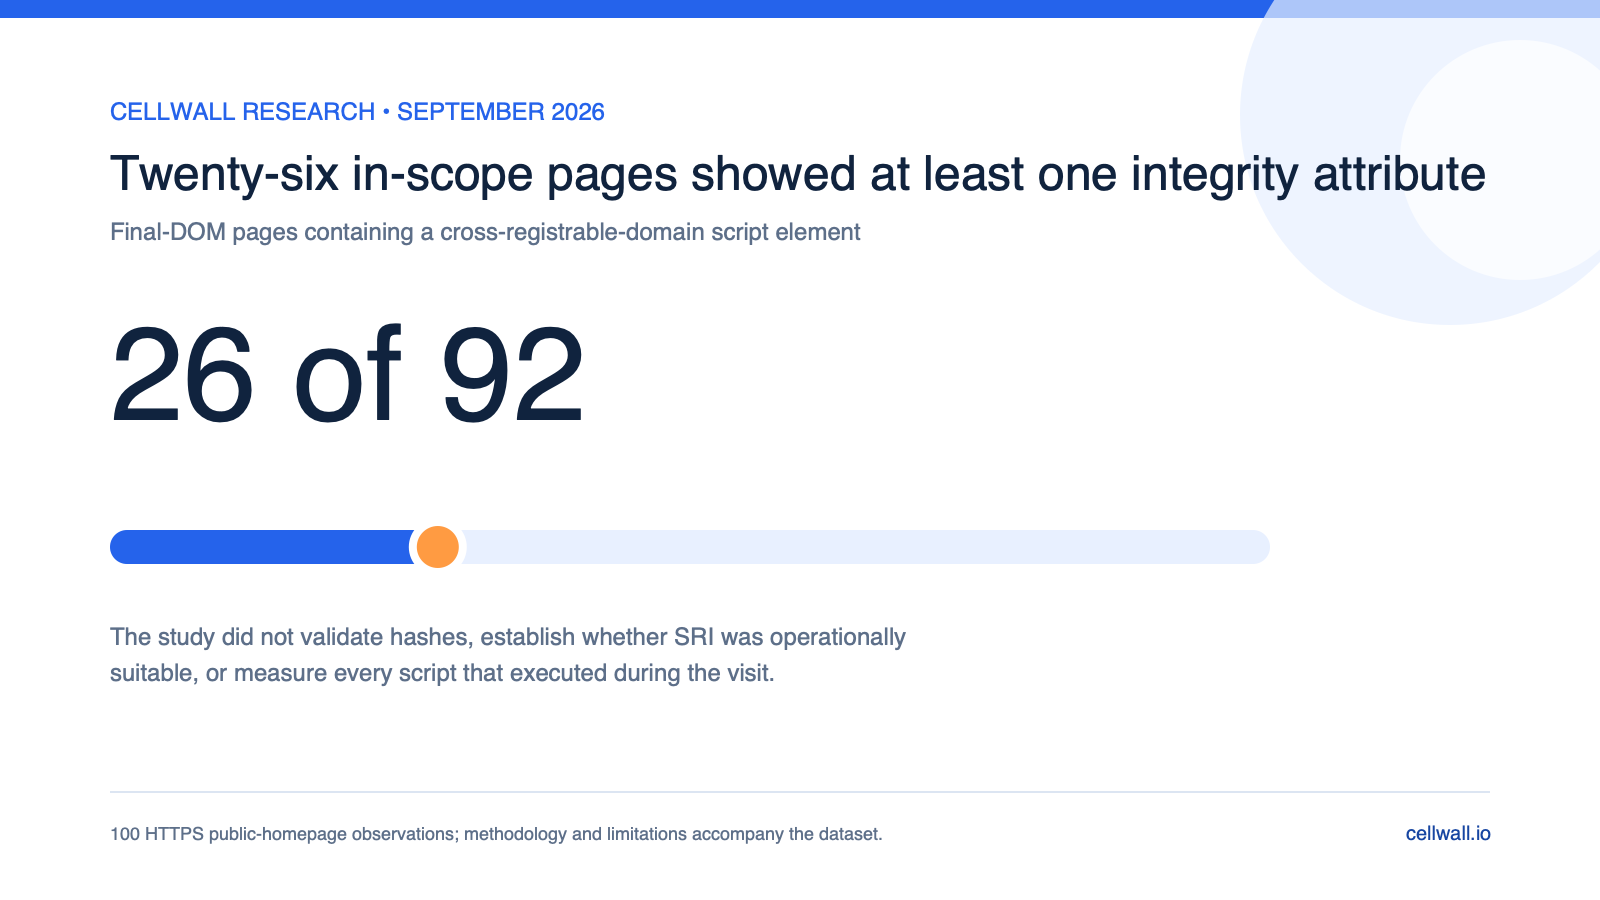
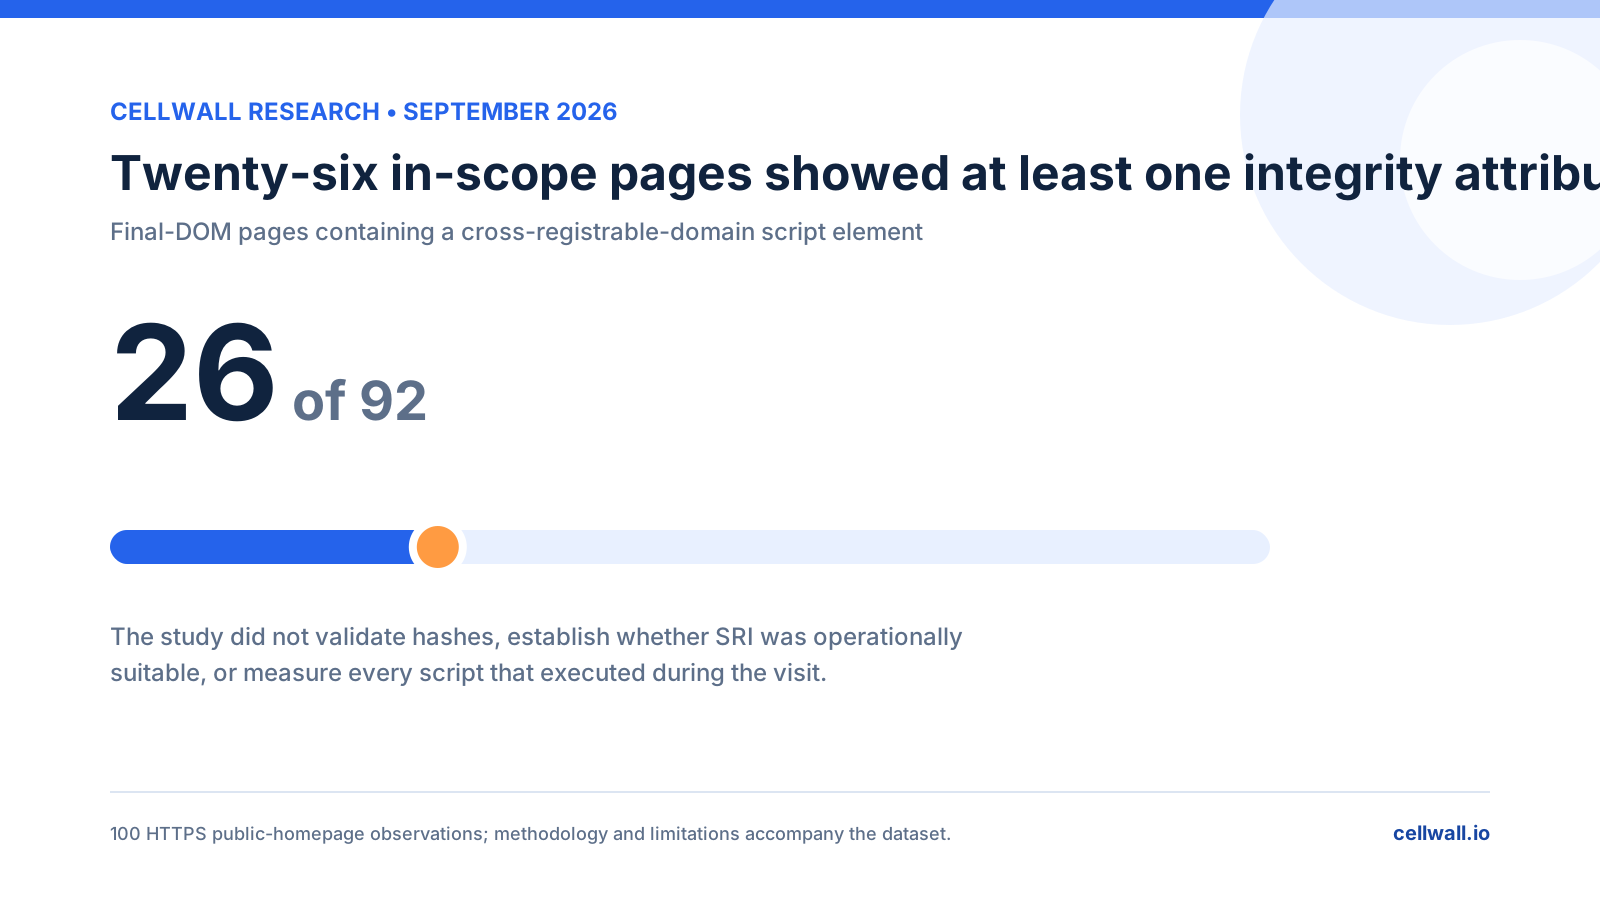
Chart showing at least one integrity attribute on 26 of 92 in-scope pages

Integrity attribute presence

The study did not validate hashes, establish whether SRI was suitable, or measure every script that executed.

Secure Your Front-end

Request a Demo

Join the leading security teams protecting their digital supply chain with CellWall.

By submitting this form, you agree to our privacy policy and terms.

Charts | State of Client-Side Exposure 2026